Dashboard tab allows getting quick visual graphical reports.
There are several Dashboards available in PPM Express TIME and we will review them all in this article.
Please note: Dashboards are displayed according to the user roles in PPM Express Time:
Tenant Administrators and Resource Managers can review the full list of available Dashboards: Personal Time, Employees, Out of Office, and Performance.
Project Managers and Users can review only Personal Time and Out of Office Dashboards.
Please find more information about roles in PPM Express Time in the User Roles article.
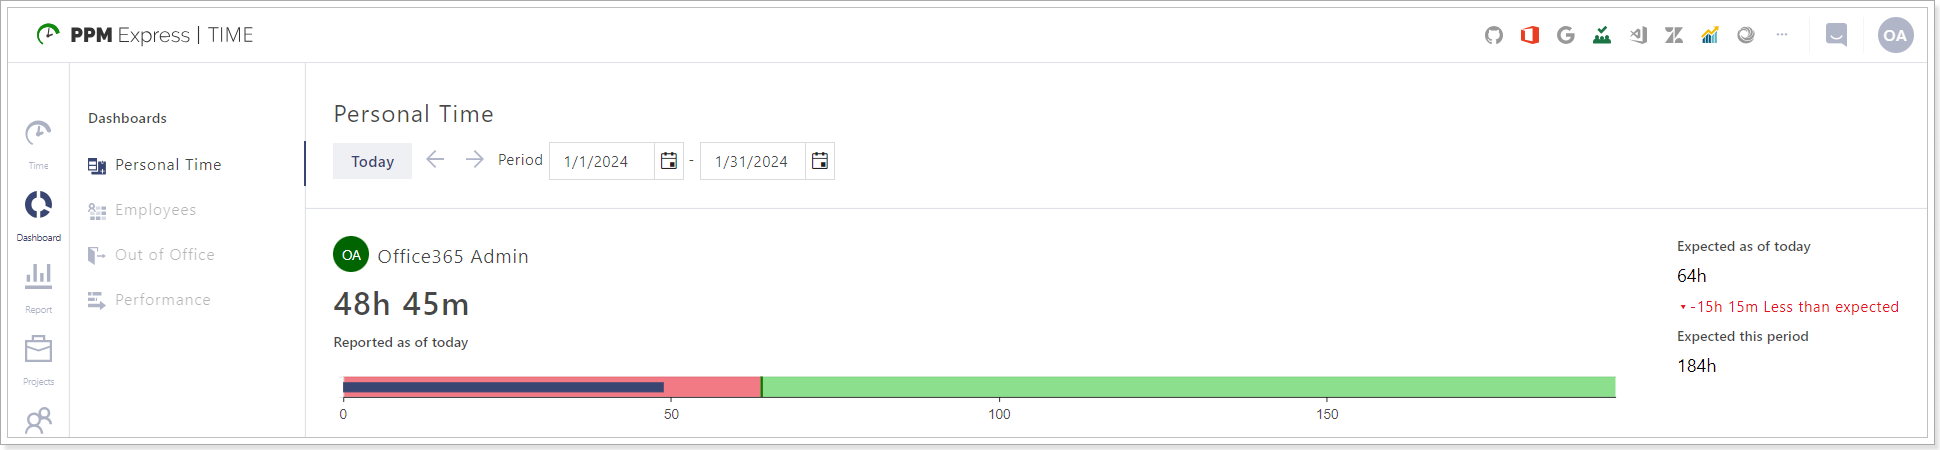
Personal Time Dashboard
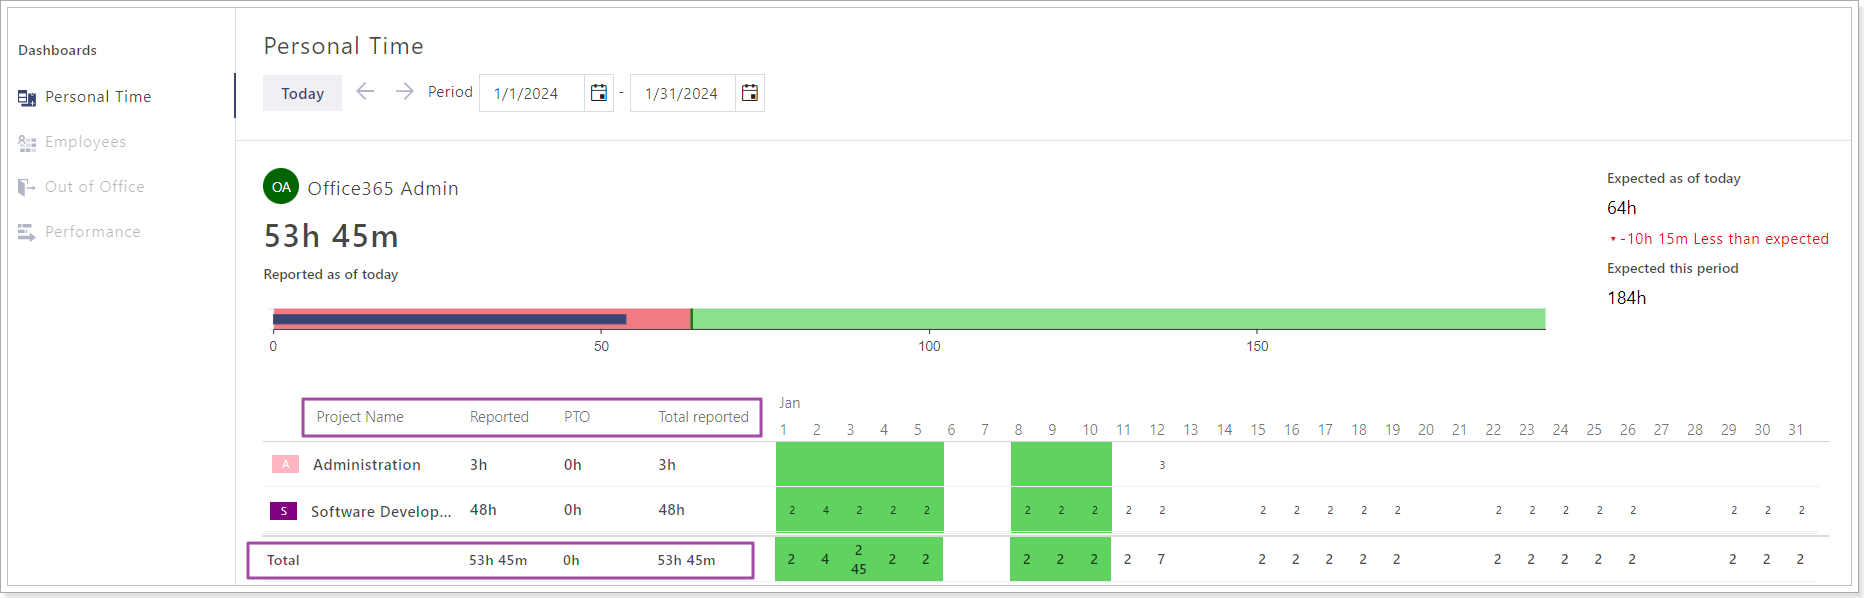
Personal Time Dashboard provides information on the amount of time logged by the PPM Express TIME user during the selected time period.
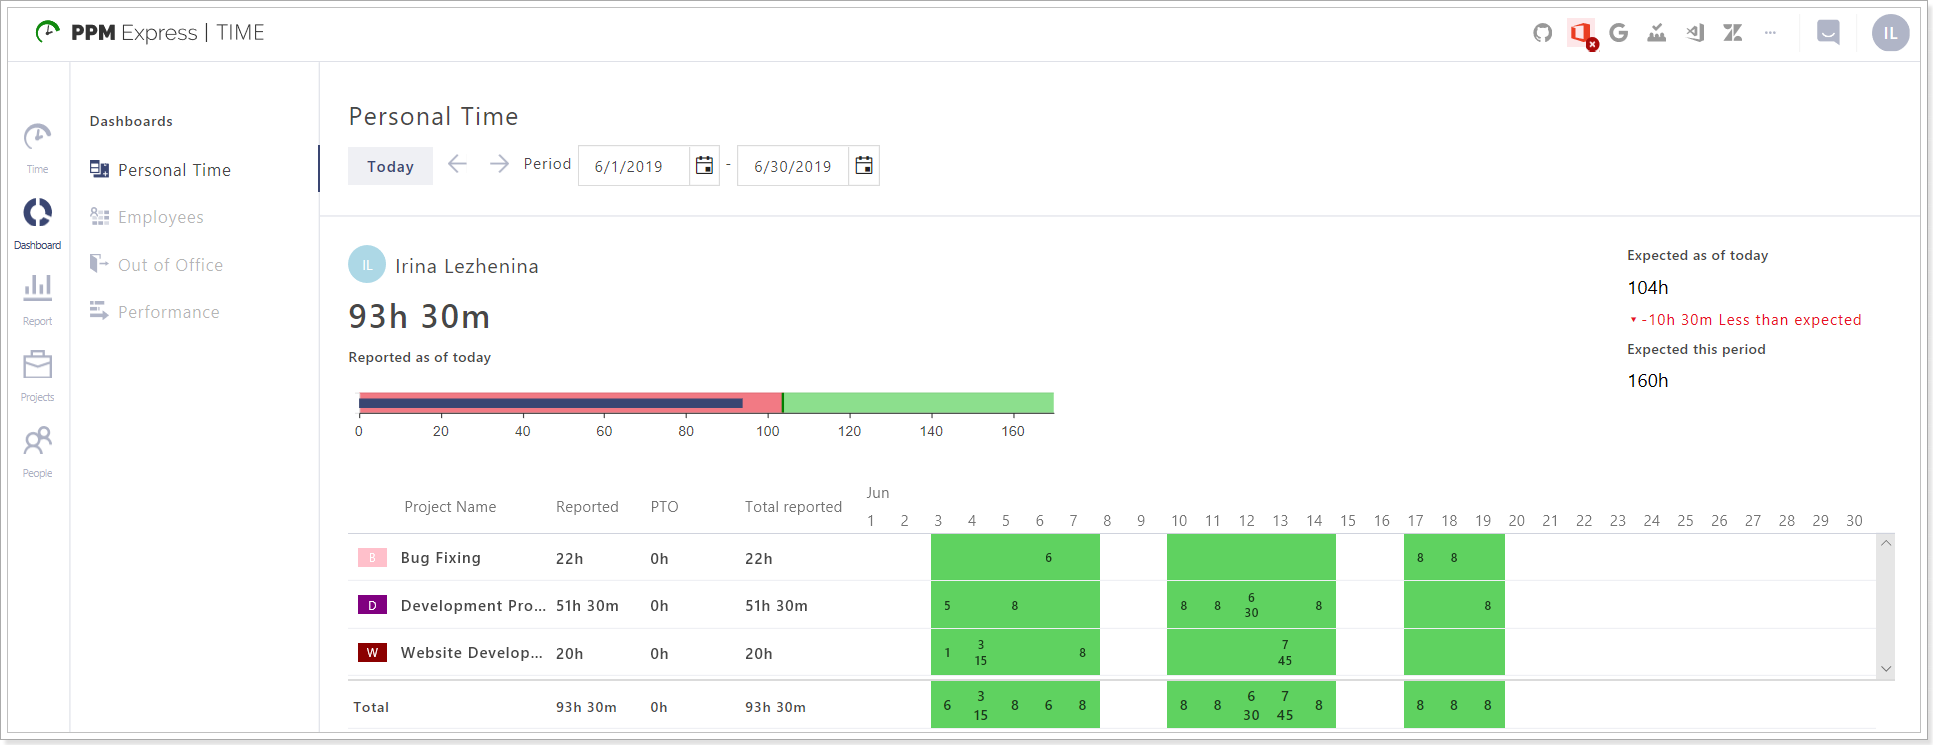
Time period selector allows choosing the start and end dates for your Dashboard.

Reported as of today section displays work hours reported for the selected time period until today (including hours reported for today).
Expected as of today section displays work hours that are expected to be reported for the selected time period until today (including hours reported for today). It displays the number of working days for the selected period until today multiplied by the number of working hours per day (according to the Day duration settings).
Expected this period section displays work hours that are expected to be reported for the whole time period selected. It displays the number of working days for the selected period multiplied by the number of working hours per day (according to the Day duration settings).
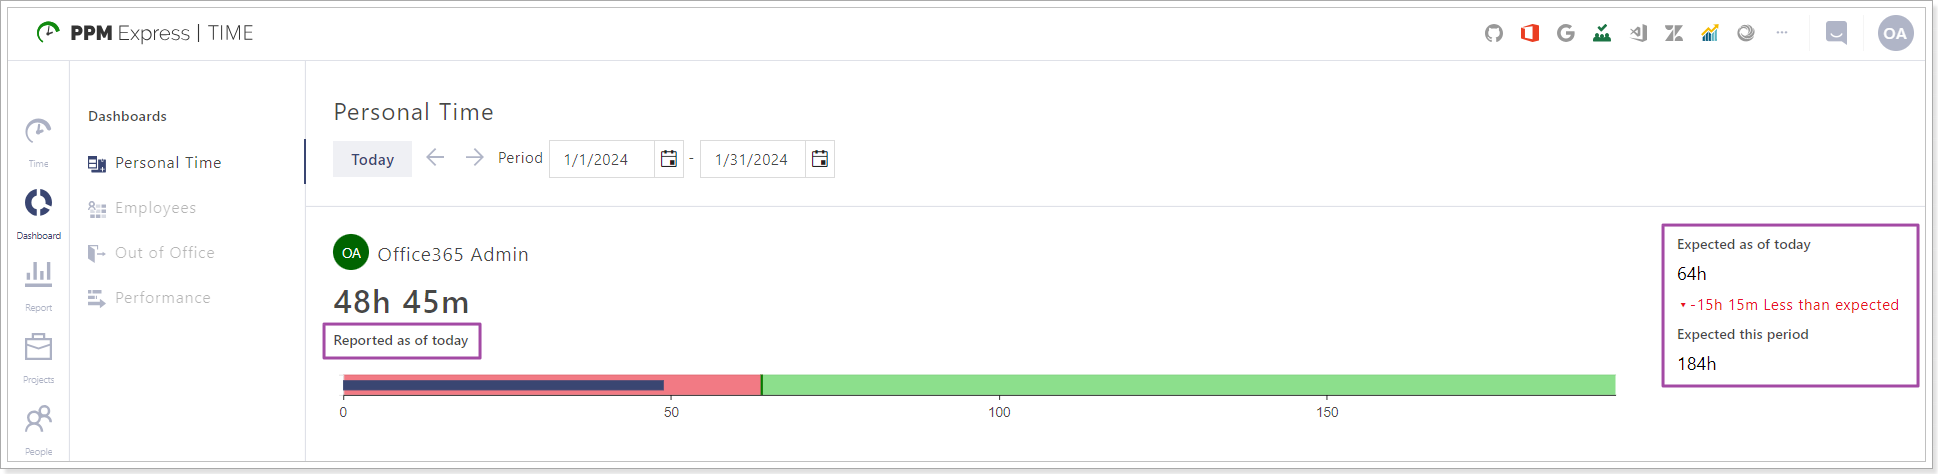
Progress bar displays reported hours for the whole selected period and has color differentiation:
- Blue Line displays the total reported work hours for the selected time period until today;
- Red Line displays the total expected hours to be reported for the selected time period until today;
- Green Line displays the total hours that are expected to be reported for the whole time period selected plus 10 hours.
The table displays information for:
Project name - the names of projects for which work time can be reported including Vacation, Sick Leave, OOF;
Reported - number of hours reported for each project (OOF is not taken into account);
PTO (personal time off) - number of hours spent as personal days off apart from Vacation;
Please note: Personal time off is not taken into account in total reported hours, as this time is counted as an unpaid leave.
Total Reported - total number of hours reported for every project separately
Total - total number of hours reported for each section (reported, PTO, Total reported) for all projects altogether.
Heat Map - displays the number of hours reported for every day per each project. Total number of hours for all projects together is also counted.
- Days that are marked in green color have more then 0 hours reported;
- Days that are marked in red color have 0 hours reported.
Employees Dashboard
Employees Dashboard displays a summary of the amount of time logged by PPM Express TIME Users in the tenant during the selected time period.
Please note: Employees Dashboard is available for Tenant Administrators and Resource Managers only.
Tenant Administrators can review summary information for all users that exist on the tenant. Resource Manager can review summary information for users who are assigned to this Resource Manager only.
Time period selector allows choosing the start and end dates for your Dashboard.
Users selector allows choosing the users you would like to review information for.
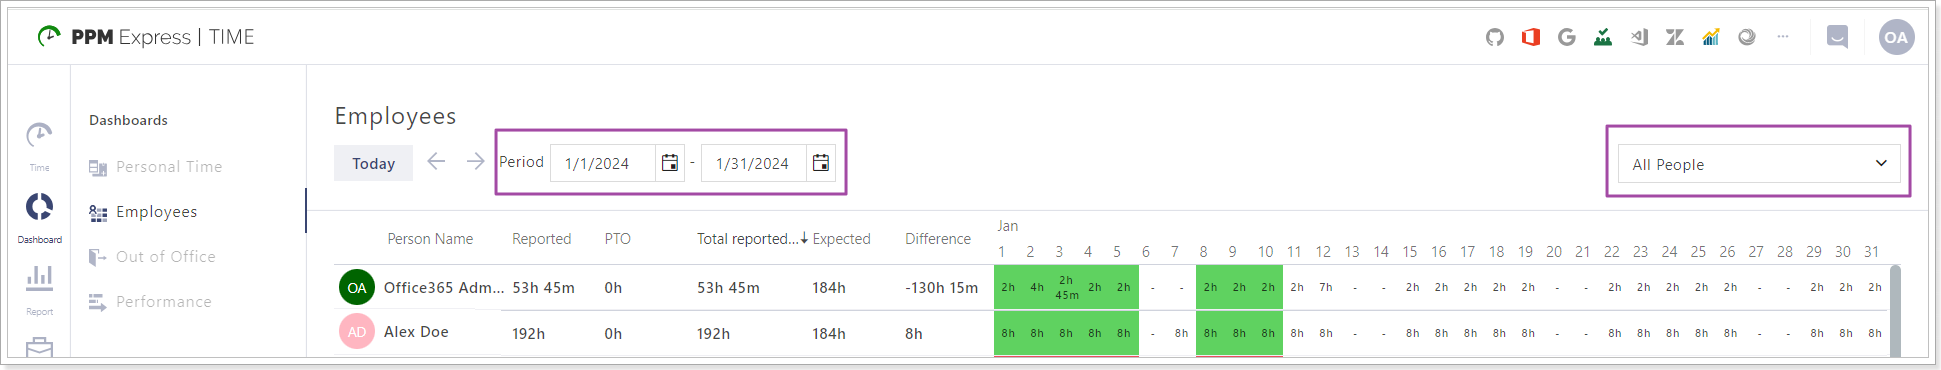
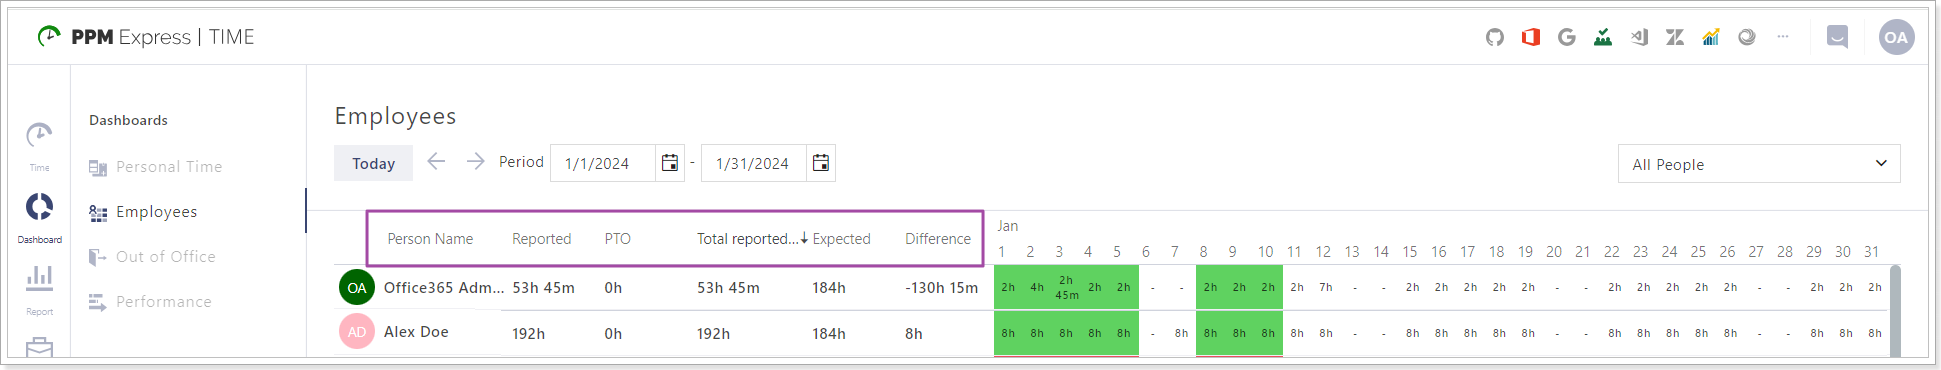
The table displays information for:
Person Name - the names of PPM Express TIME Users;
Reported - number of hours reported for each user (all projects included);
PTO (personal time off) - number of hours spent as personal days off;
Total Reported - total number of hours reported for all projects by users;
Expected - total number of hours expected to be reported for the selected period of time for all project;
Difference - shows the difference in Reported hours and Expected hours.
Please note: Personal time off is not taken into account to calculate the Difference, as personal time is counted as unpaid leave.
Heat Map - displays the information for reported hours per day.
- Days that are marked in green color have more than 0 hours reported;
- Days that are marked in red color have 0 hours reported.
Out of Office Dashboard
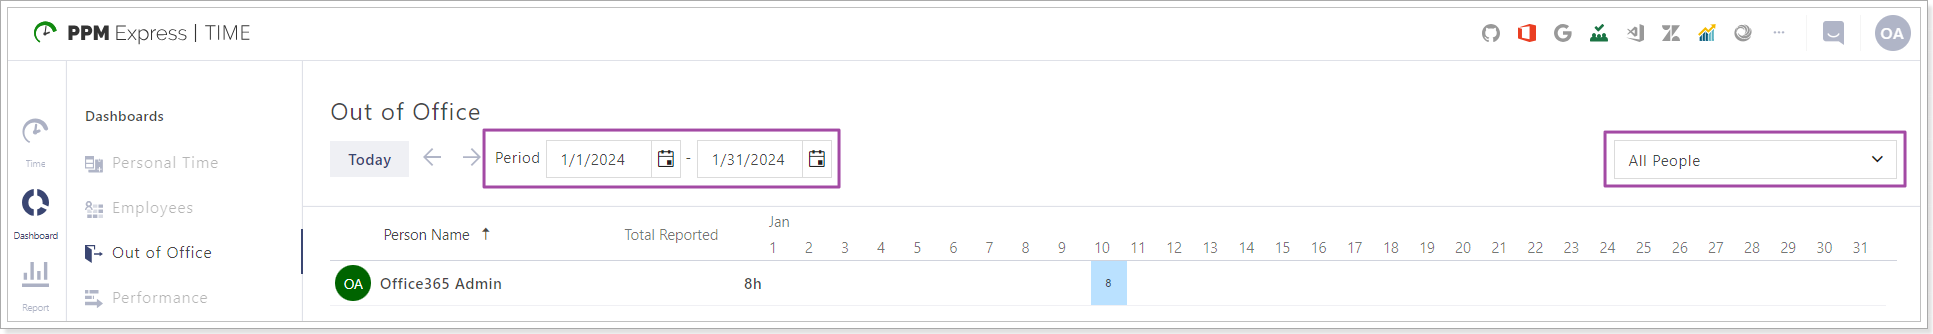
Out of Office Dashboard displays information for users who are out of the office for the selected time period, including Vacation, Sick Leave, and Personal Time Off.
Time period selector allows choosing the start and end dates for your Dashboard.
Users selector allows choosing the users you would like to review information for.
The table displays information for:
Person Name - the names of PPM Express TIME Users;
Total Reported - total number of hours reported for all projects by users;
Heat Map - displays the information for out-of-office hours of a user per day and has color differentiation:
- Green color marks days spent on Vacation;
- Yellow color marks days spent for Sick Leave;
- Blue color marks days spent for Personal Time Off.
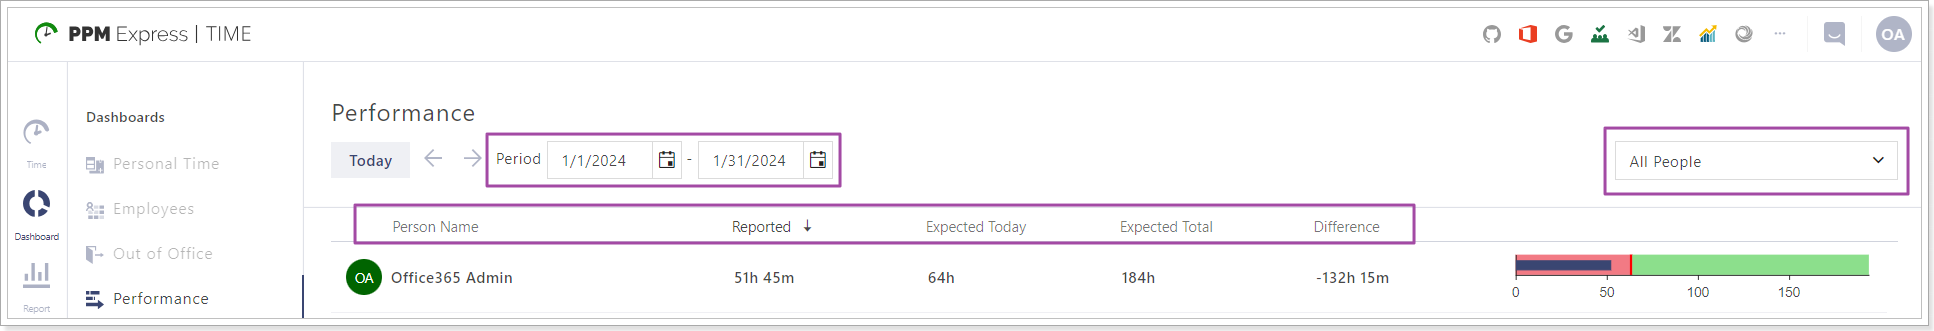
Performance Dashboard
Performance Dashboard displays a summary of the amount of time logged by PPM Express TIME Users in the tenant during the selected time period.
Please note: Performance Dashboard is available for Tenant Administrators and Resource Managers only. Tenant Administrators can review summary information for all users that exist on the tenant. Resource Manager can review summary information for users who are assigned to this Resource Manager only.
Time period selector allows choosing the start and end dates for your Dashboard.
Users selector allows choosing the users you would like to review information for.
The table displays information for:
Person Name - the names of PPM Express TIME Users;
Reported - number of hours reported for each user (all projects included)
Please note: Personal time off is not taken into account to calculate Reported hours in the Performance Dashboard, as personal time is counted as unpaid leave;
Expected Today - number of hours expected to be reported for the selected period of time for all projects as of today;
Expected Total - total number of hours expected to be reported for the selected period of time for all projects;
Difference - shows the difference in Reported hours and Expected Total hours.
Progress bar displays reported hours by each user for the whole selected period and has color differentiation:
- Blue Line displays the total reported work hours for the selected time period until today;
- Red Line displays the total expected hours to be reported for the selected time period until today;
- Green Line displays the total hours that are expected to be reported for the whole time period selected plus 10 hours.