
Budget management in PPM Express is done via the Financials widget, which creates a separate budget for each Portfolio, Program, or Project you add or import. Also, the Project Benefits section is available to manage plans and assessments of expected positive outcomes from the implementation.
You do not need to additionally install the Financials app to use the Budgets section. Financials is a built-in widget in PPM Express that you can use to manage your budgets.
The Manage Financial Details permission is required for users to manage budgets/benefits.
The months displayed in the Budget/Benefits section depend on the Start and Finish dates of the Project, despite the selected Display period. If there are no Start and/or Finish dates for the Project, the Budget will be created for one month only, by default. After budget/benefits creation, the dates can be updated only upwards.
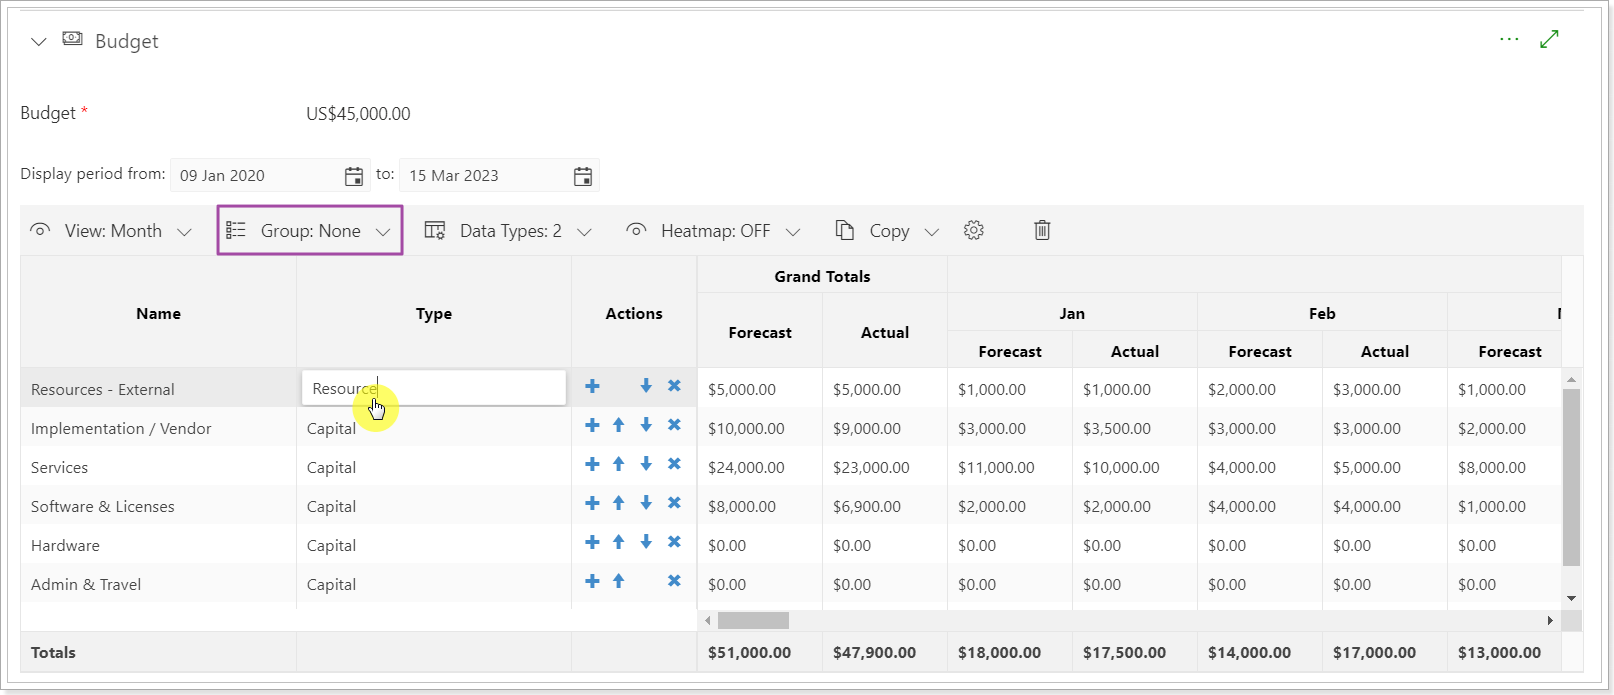
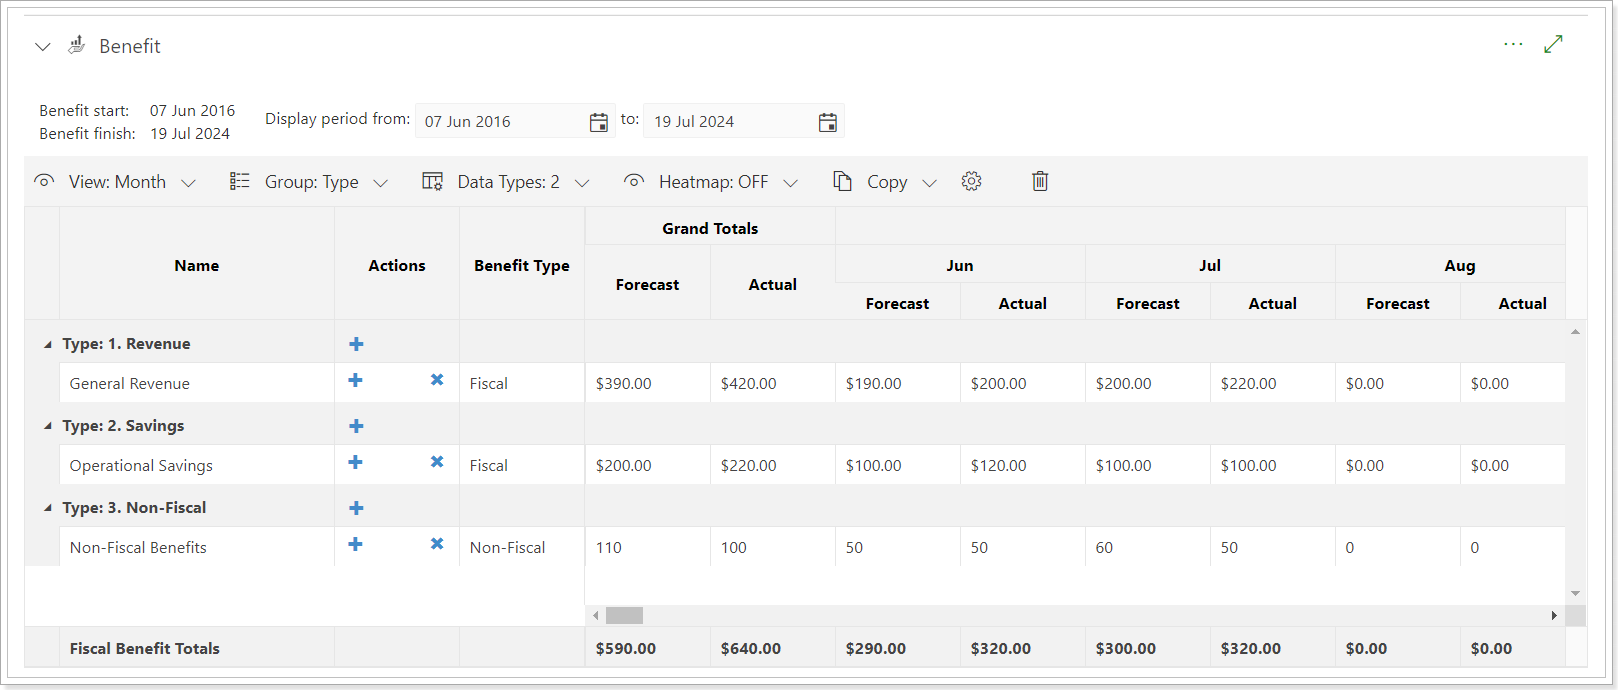
Project Budget
The following details and options are available in each budget:
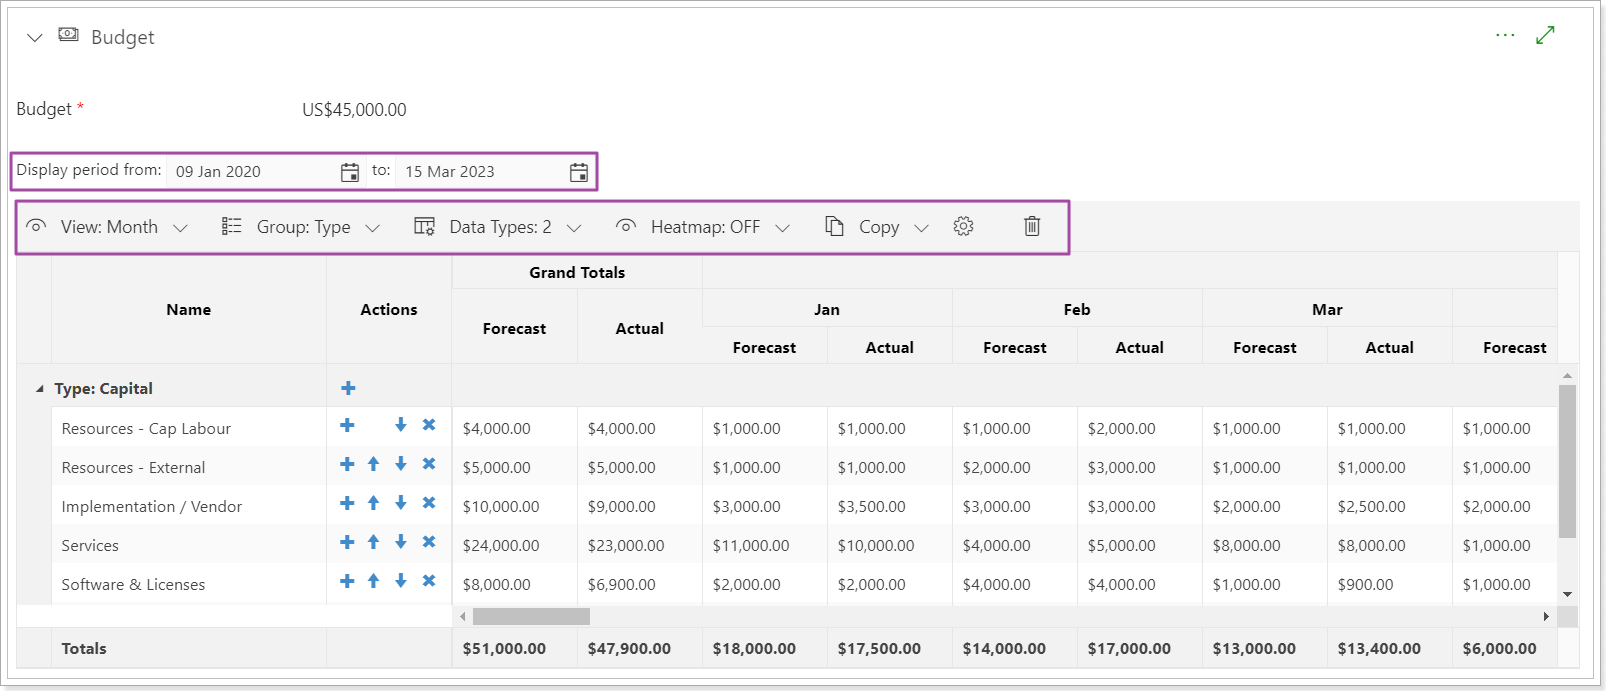
1. Display period is the period that Financials shows data for.
2. View allows changing data visualization: by Month, Quarter or Year.
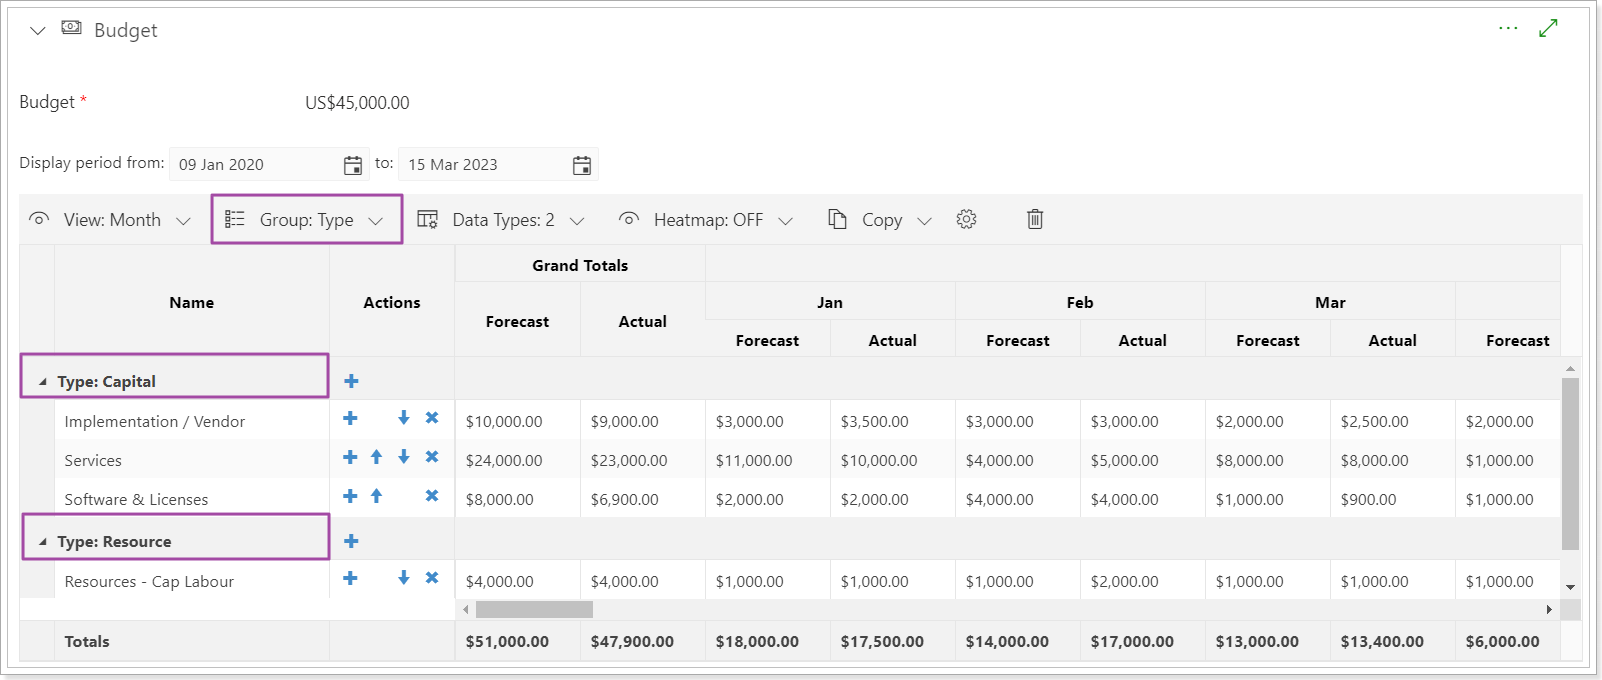
3. Group type allows editing the 'Type' section and then grouping the information by type.
Select the 'None' option to add new types or edit the existing ones.
Once you are done editing, select the 'Type' option, and the Budget information will be grouped by the types you created.
4. Data types option allows adding/removing which financial data types are calculated: Forecast, Baseline, Actual.
5. Heatmap option will help you to visualize your budget and display whether the Forecast data is greater than the Baseline.
6. Copy:
- Forecast To Baseline allows copying current values from the Forecast column copy to the Baseline column.
- Baseline to Forecast allows copying current values from the Baseline column to the Forecast column.
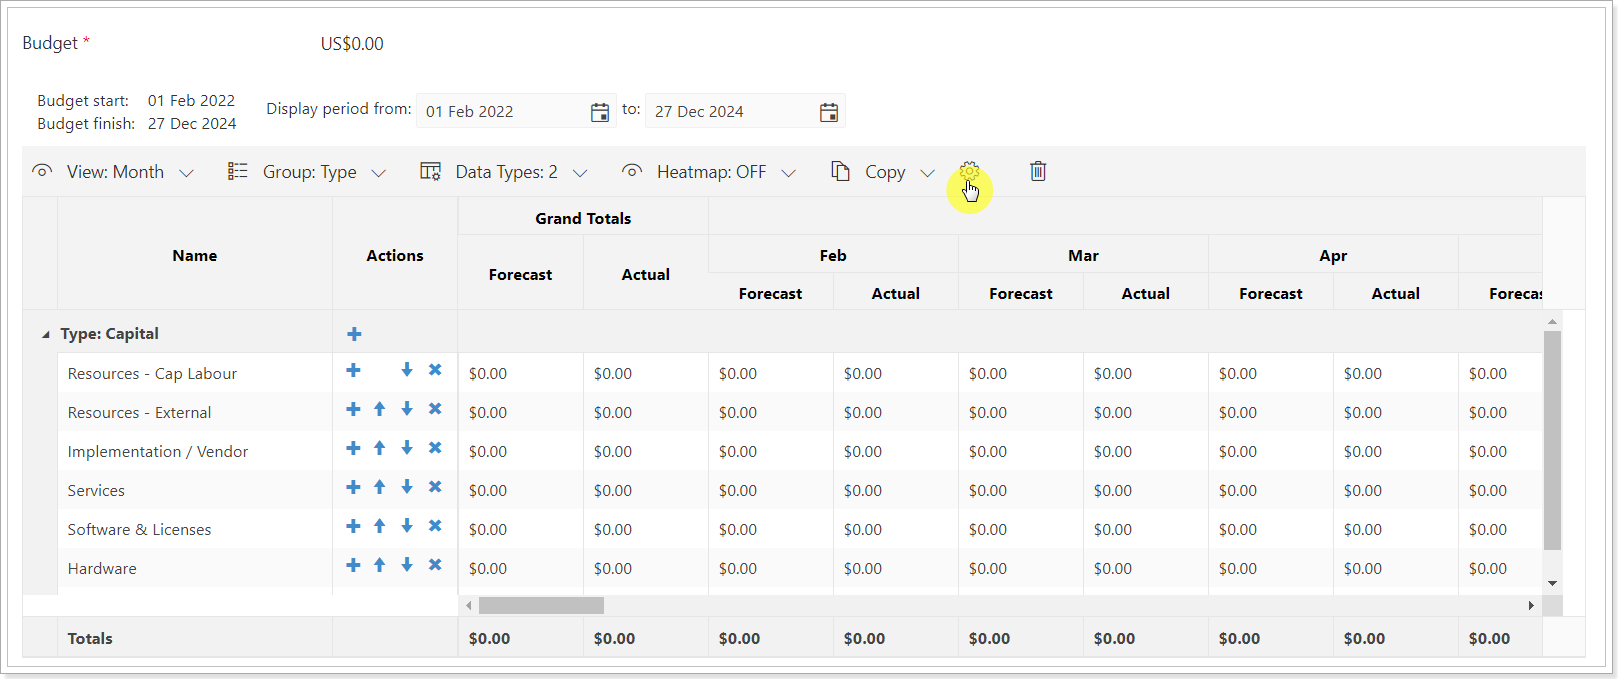
7. Gear button redirects to budget settings.
8. Delete option deletes all budget information for the Project. When the budget is deleted, all custom settings will be deleted from the Budget section. The section will be ready to create a new budget from scratch.
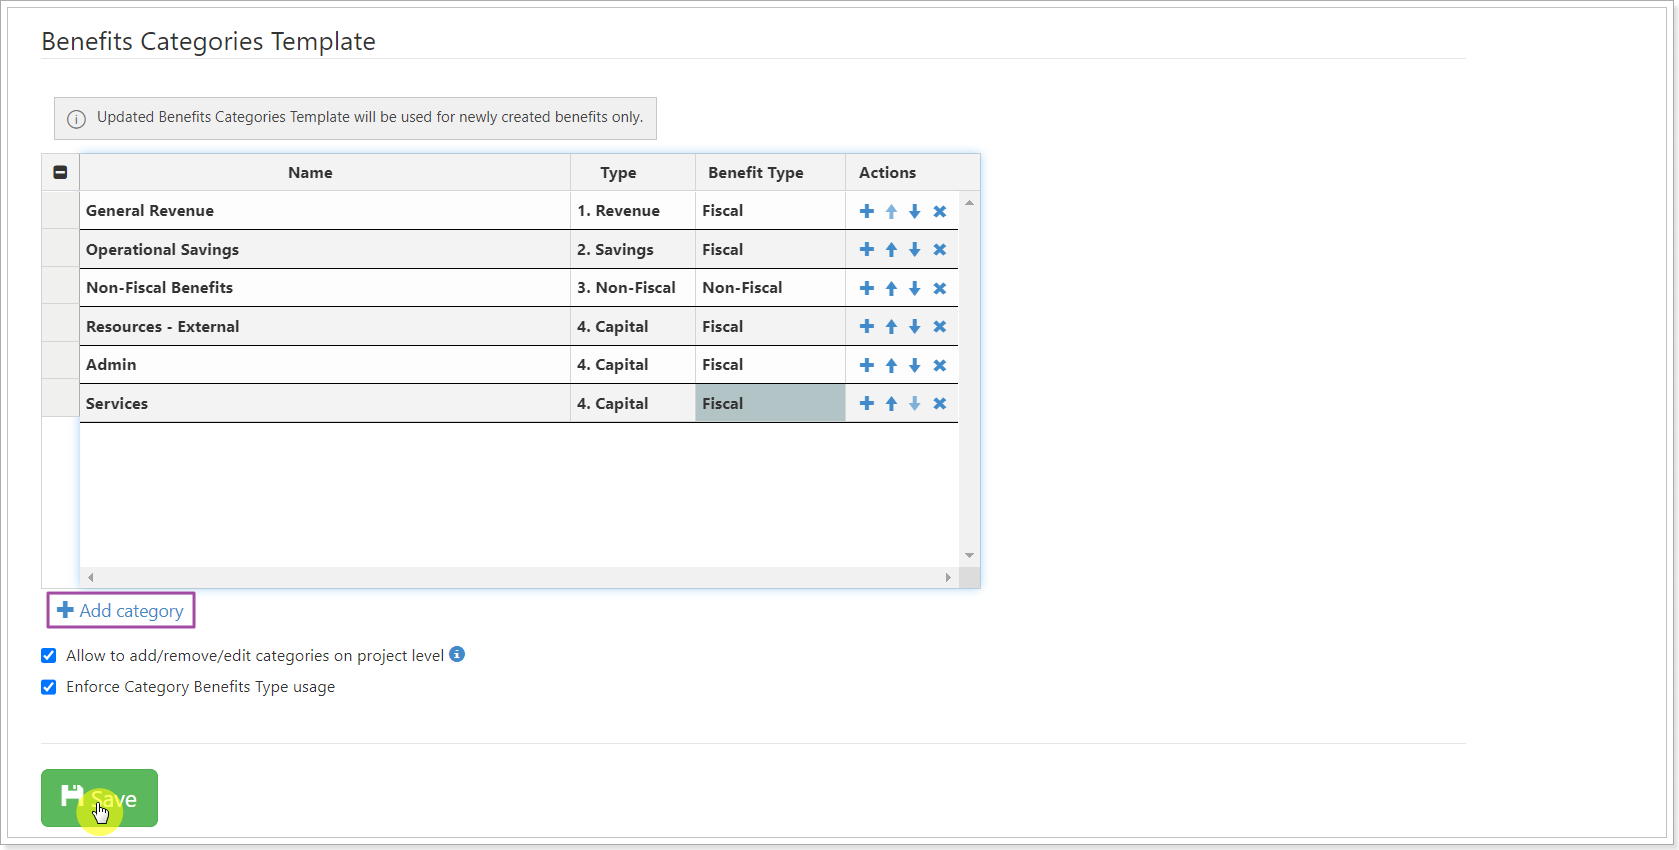
It is highly recommended to configure the budget categories at once before you start creating your Project/Portfolio Budget. In this case, the template will be saved and applied to all Project/Portfolio budgets. The categories are configured via the Financials widget, which is opened by clicking on the gear-like button.
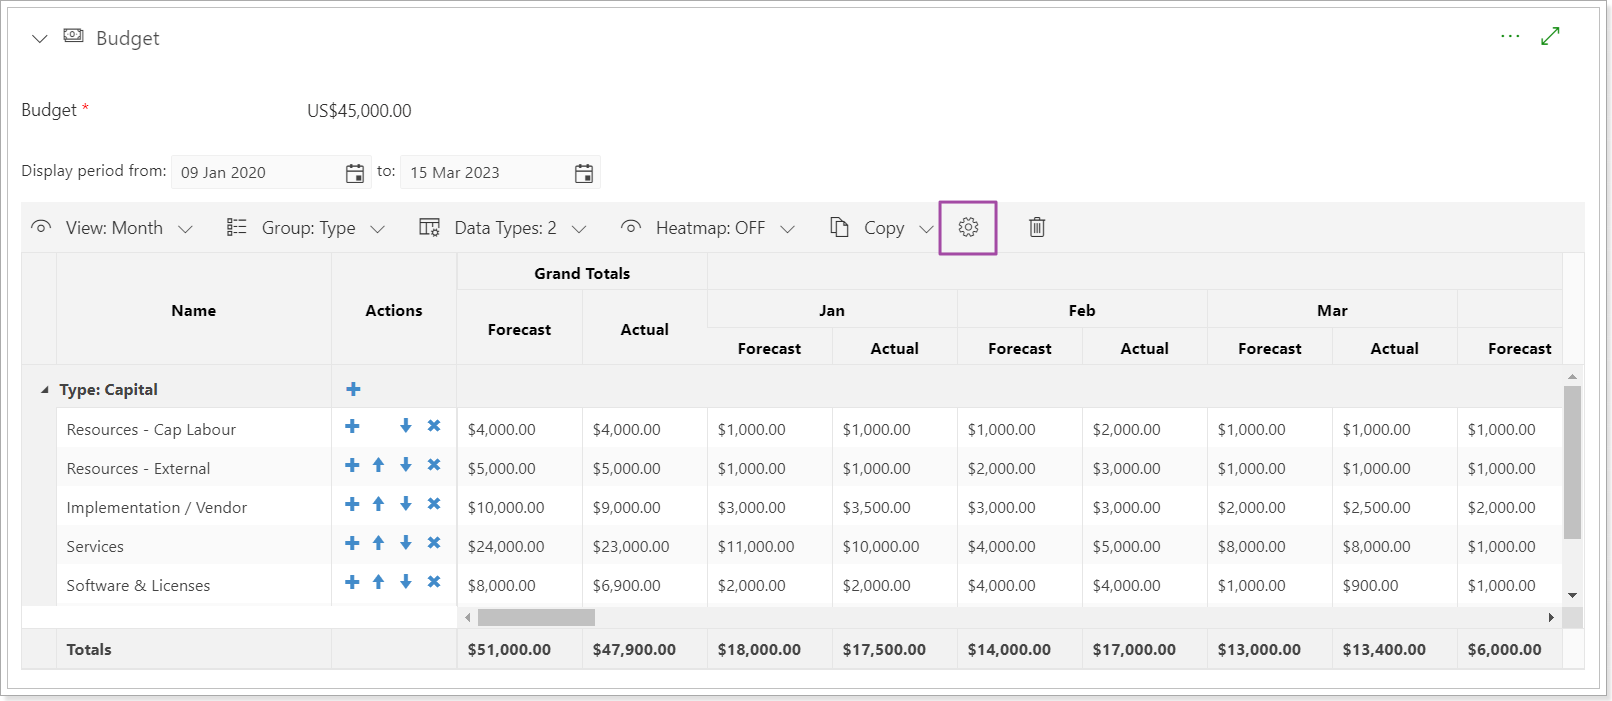
When you click on the gear-like button you will be redirected to the Financials Settings page where you can set up the categories as required.
Project Benefits
The Benefits section is available for users with Manage Financial Details permission.
The Benefits Project section is similar to the Budget section and is configured via the Financials widget.
Two formula fields were added for this section to display data as needed: Estimated ROI and Estimated ROI Baseline.
- Estimated ROI = ((Benefits Forecast - Budget Forecast)/Budget Forecast) *100%
- Estimated ROI Baseline = ((Benefits Forecast - Budget Baseline)/Budget Baseline) *100%
Also, the Benefits Start/Finish date fields are available in the Project Details section and are hidden by default.
- If there is only a start date provided for the Benefit dates, the finish date will be set automatically and the duration of the Benefit is one month by default.
- If there is only a finish date for the Benefit, the start date will be set to the first date of the month (in which the finish date was specified).
- If no dates are set for the Benefit, then the Project dates will be set automatically for the Benefit Start/Finish dates.
- If there are no dates on the Project, the current date will be taken as the Start and Finish date.
The settings and fields are similar to the Budget section.
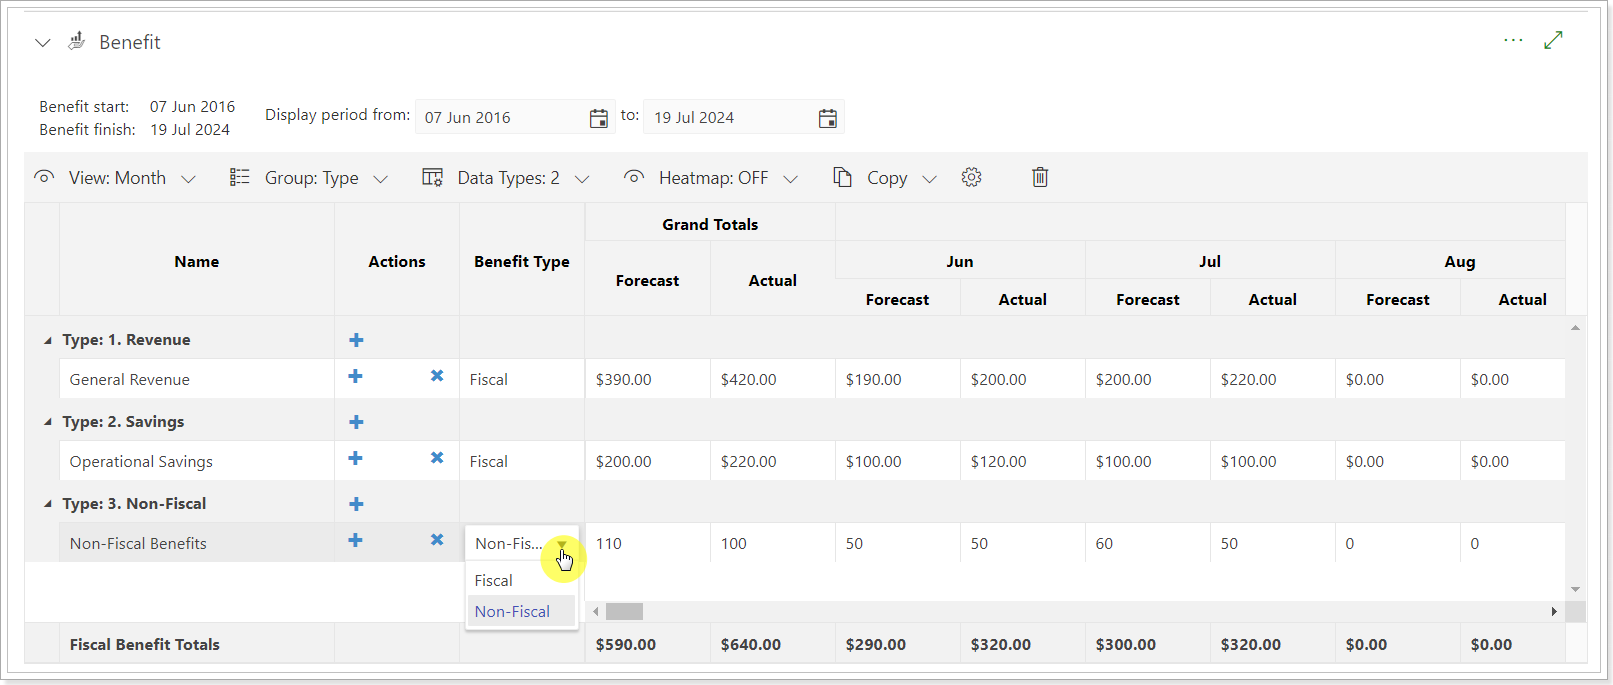
There are two Benefit types: Fiscal and Non-fiscal. Non-fiscal values are not taken into account for Totals. The type can be changed from the drop-down.
Financials widget settings
To customize the Budget and Benefits Project sections Financials widget is used.
To open the widget click on the gear button of the Budget or Benefits section.
The settings for Budget and Benefits are the same and can be accessed by selecting the corresponding tab.
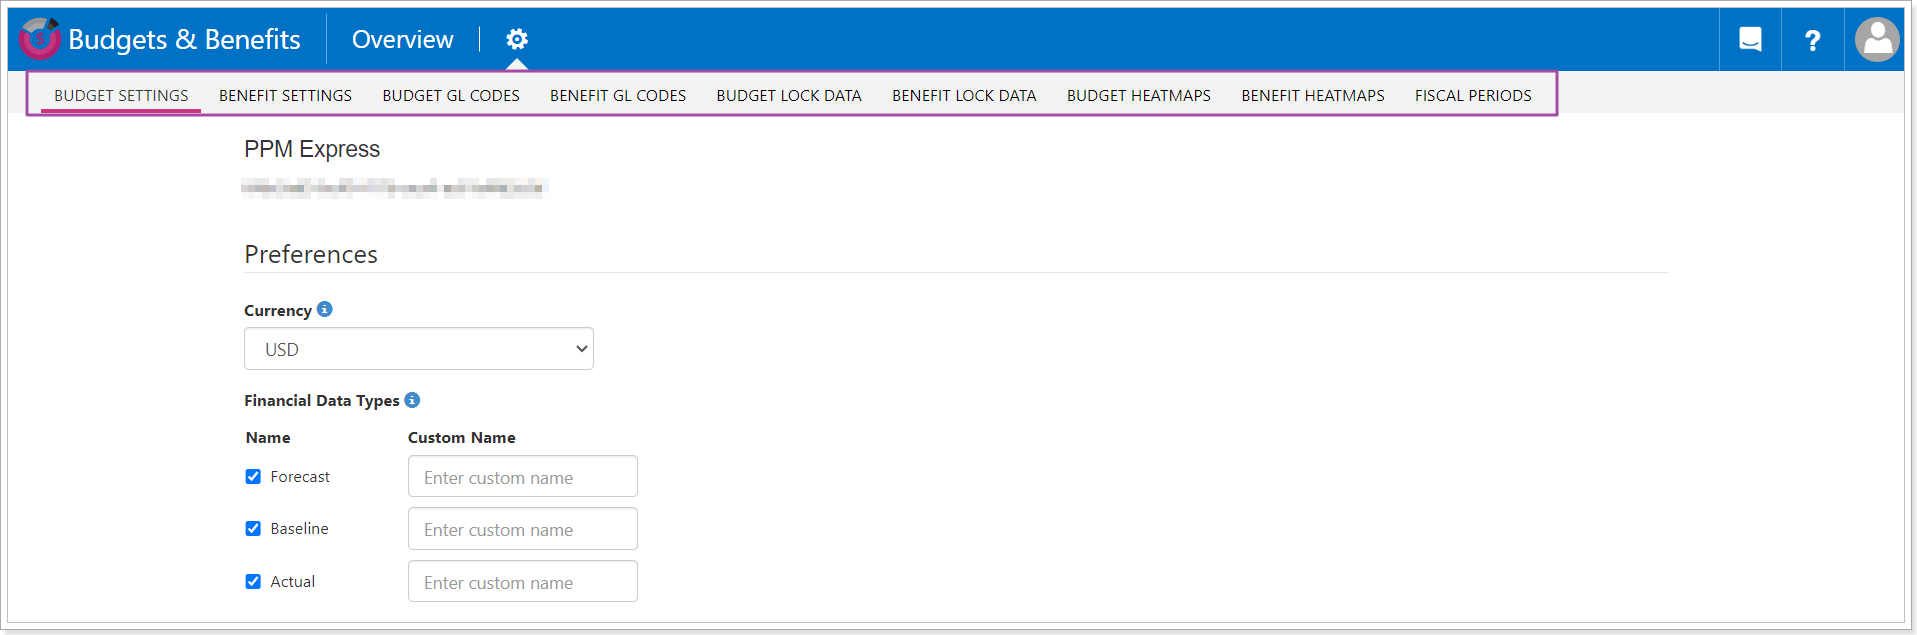
Budget/Benefits settings tab allows configuring the following:
- Currency for these Project sections
- Financial Data Types
- Custom budget/benefits column names
- Project Level Budget Entry
- Cost/Benefits Categories Template
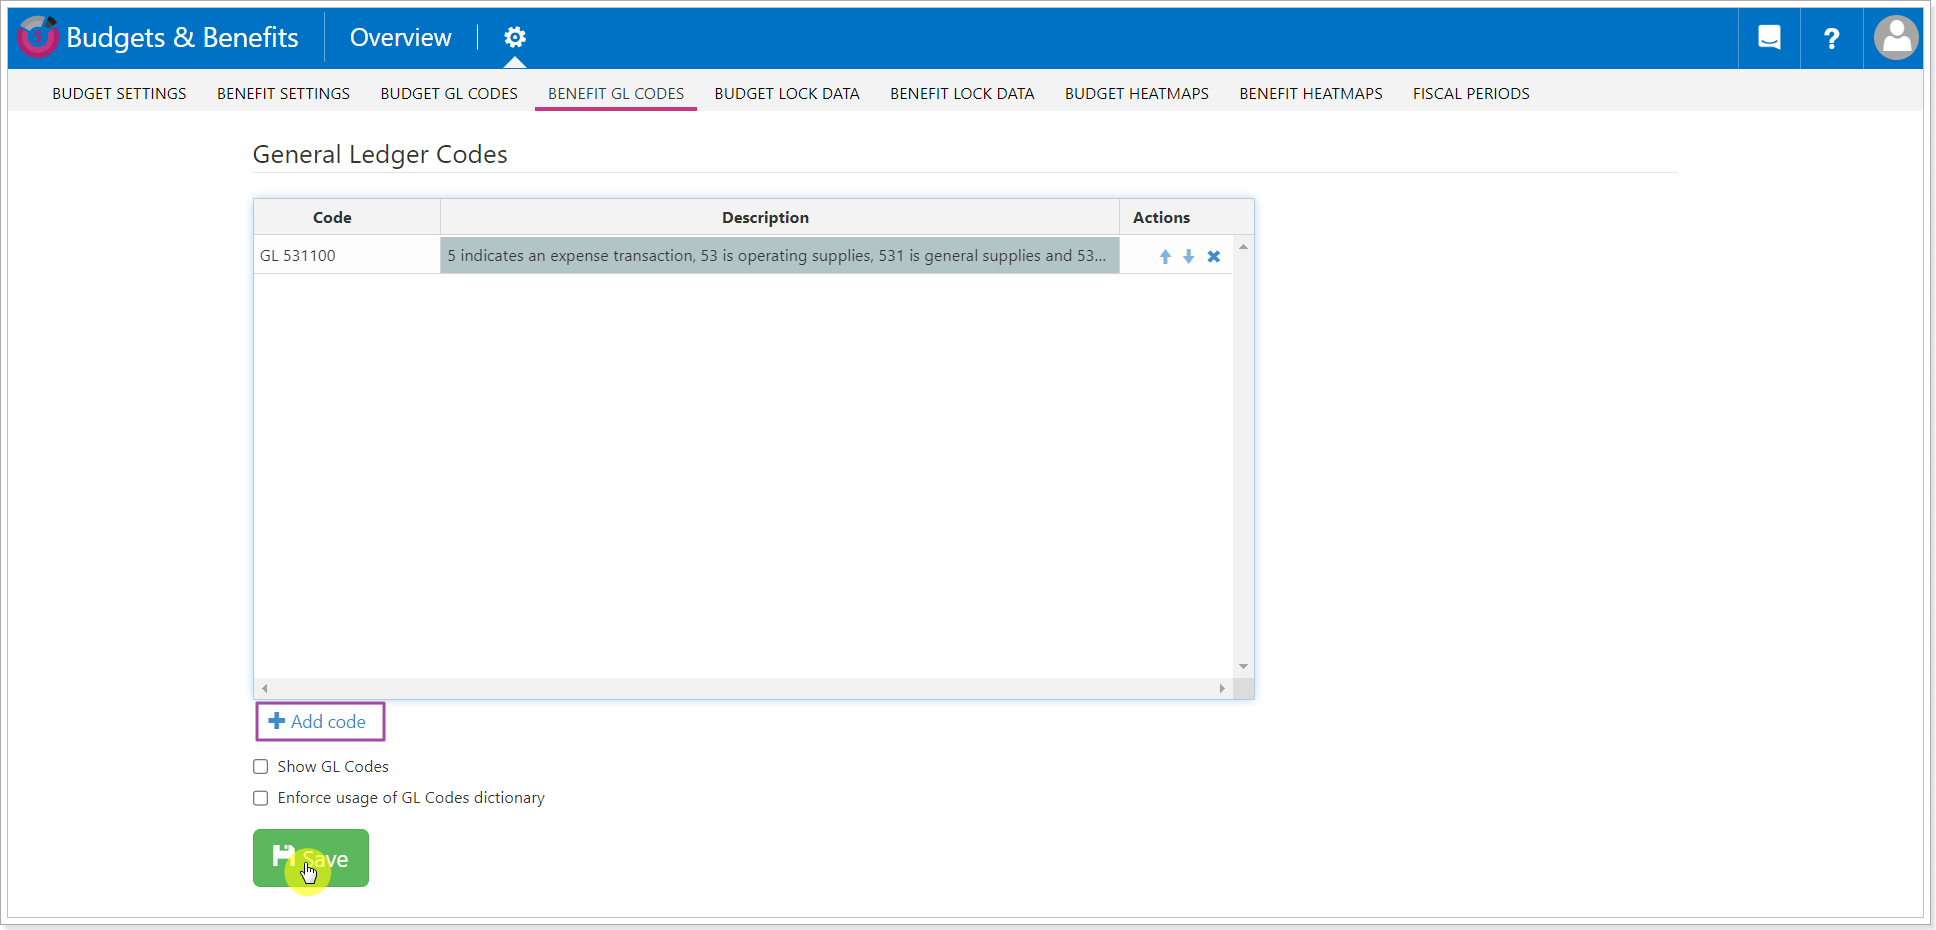
Budget/Benefits GL Code tab allows creating the list of General Ledger codes to be used for Cost Categories. Specify the code and describe it if needed. Click the Add Code button to add it to the list.
Enforce usage of GL Codes dictionary option allows to enforce using only the codes specified in this list for Cost Categories.
Show GL codes option turns on or off General Ledger codes usage.
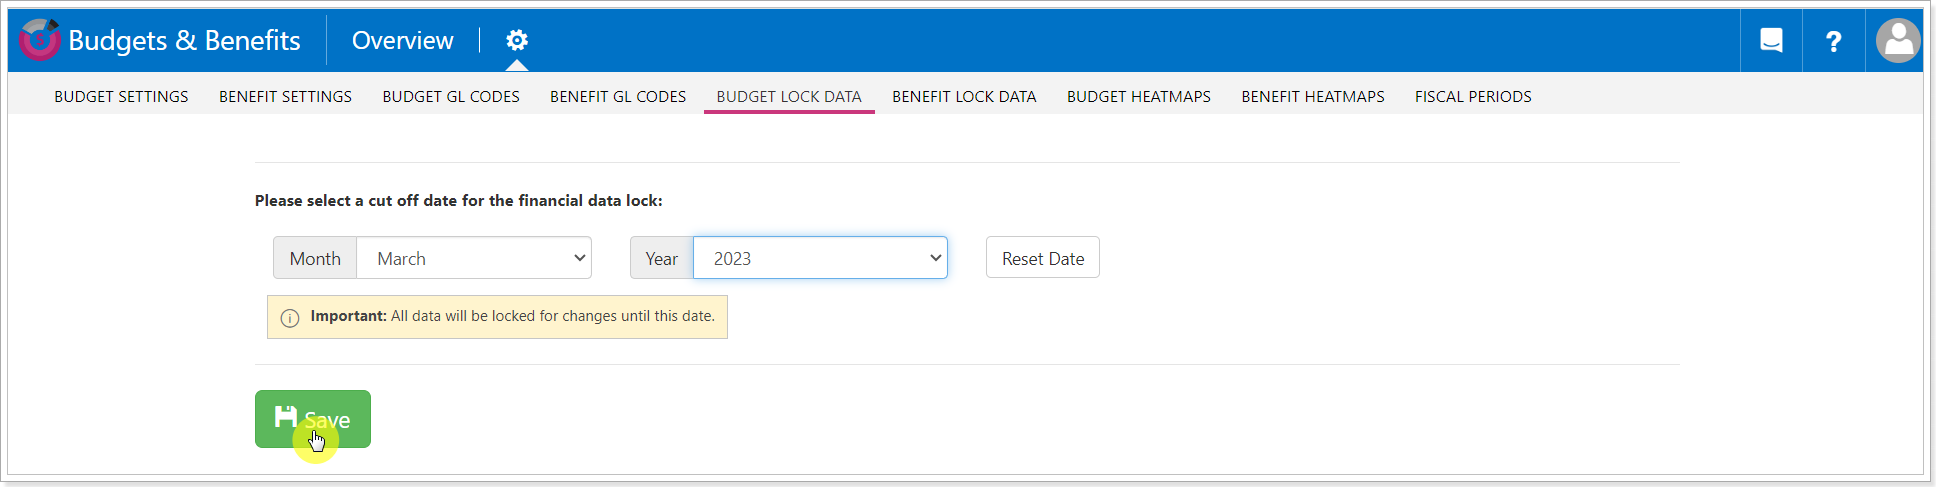
Budget/Benefits lock data tab allows blocking any changes to your past financial data.
To enable this feature, select the month and the year in the corresponding dropdowns, then click Save. All the budget data until the selected date will be locked for editing.
To disable this feature, click on Reset Date and then click on Save.
Budget/Benefits heatmaps provide a configurable visual representation of a difference between two value types in your report:
- Forecast to Baseline
- Actual to Forecast
- Actual to Baseline
When two values are compared, and their ratio is in a specific range, the first value will be highlighted.
By default, heatmaps are disabled. To enable the heatmaps option, choose one of the options from the heatmaps dropdown on the Budget page.
You can also change the colors of the existing ranges (by clicking on the range in the list and entering a hex color code) and configure additional heatmap ranges.
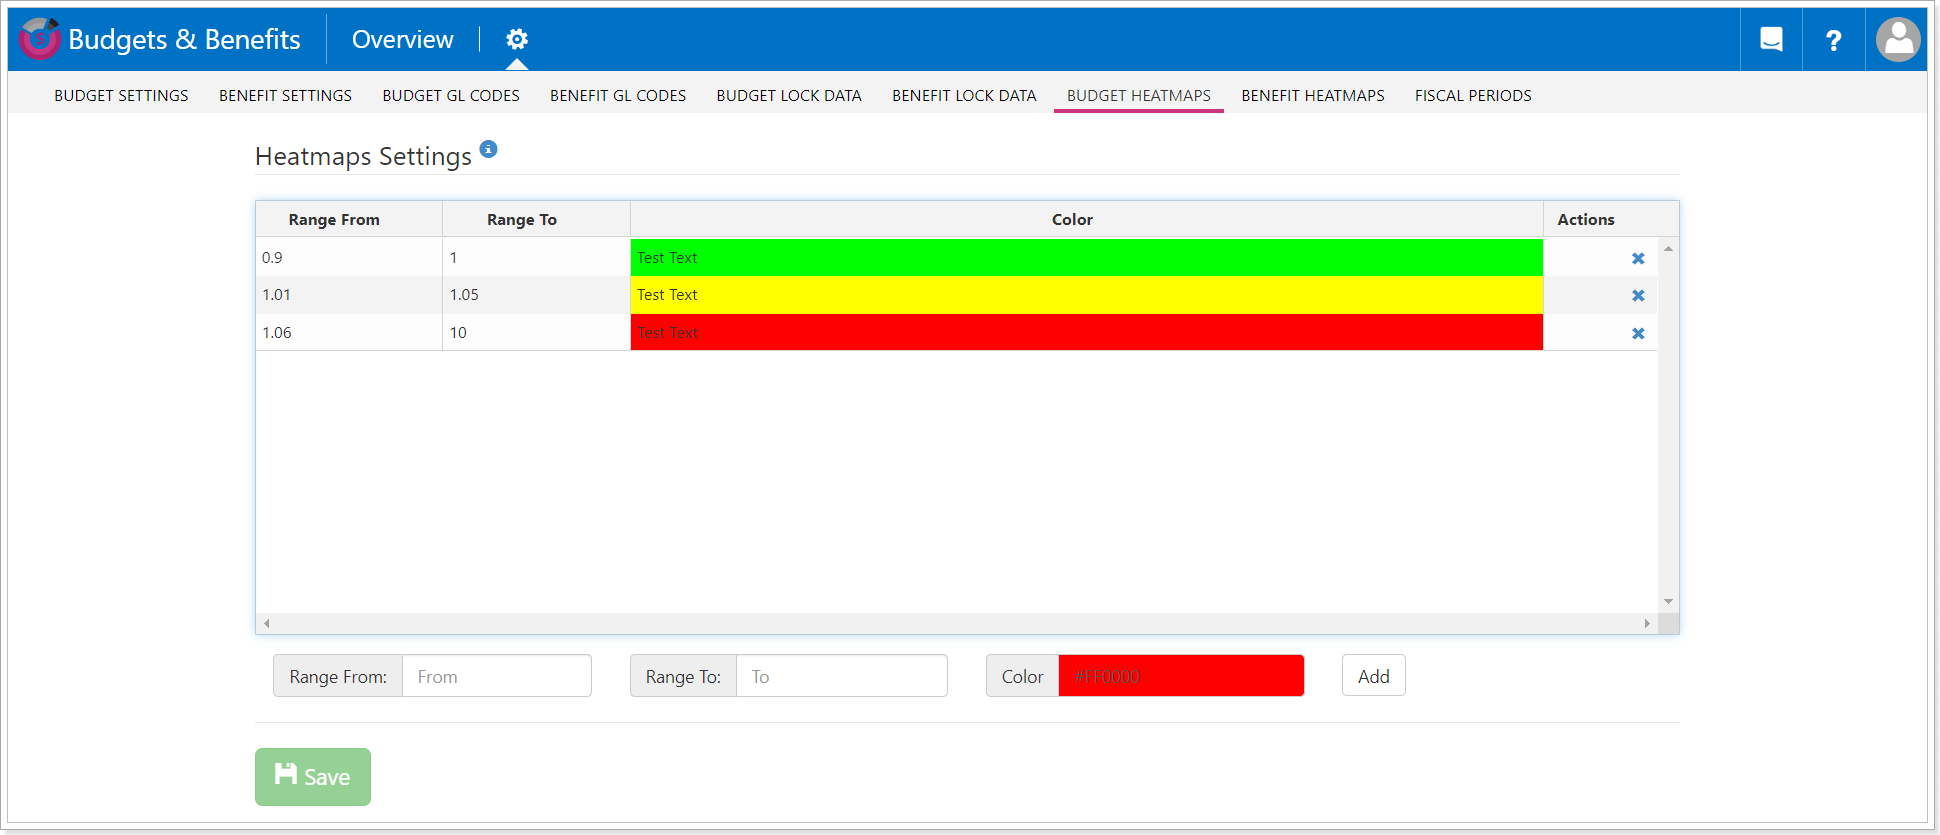
To configure an additional difference range, enter the minimum (Range from field) and the maximum (Range to field) values and choose the preferred color. The minimum step of any range is 0.01.
Any new range you create should be adjacent to the existing ones with the minimum step. For example, the ranges configured by default cover the values from 0.9 to 2. This means, that your new range should have either the maximum value of 0.89 or the minimum value equal to 2.01.
Also, your new range should not intersect with the existing ones.
Fiscal periods tab allows setting up Custom Fiscal Periods to display finances for the fiscal year the companies are using. It is possible to set up any Fiscal Periods depending on the company policy.
The Minimal Fiscal Period duration is one day.
To set Fiscal Periods perform the following:
- Click the Add New Period button and select the required start date, and end date in the corresponding dropdowns.
- Provide the Fiscal Period name;
- Click Update to save the changes.
Use the Edit button to edit the existing Fiscal Periods. Use the Delete button if you need to delete a Fiscal Period.
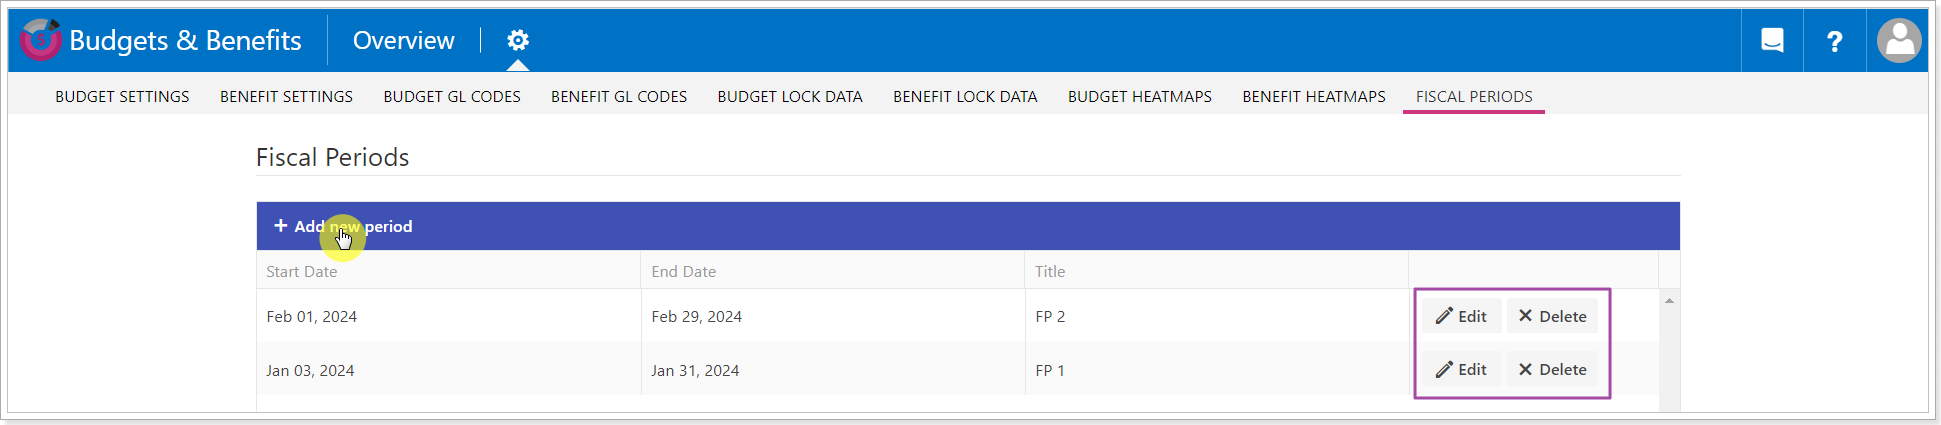
Add as many periods to the tenant as required. As Fiscal Periods are added, they can be applied to Financial reports in the Budget Project section.
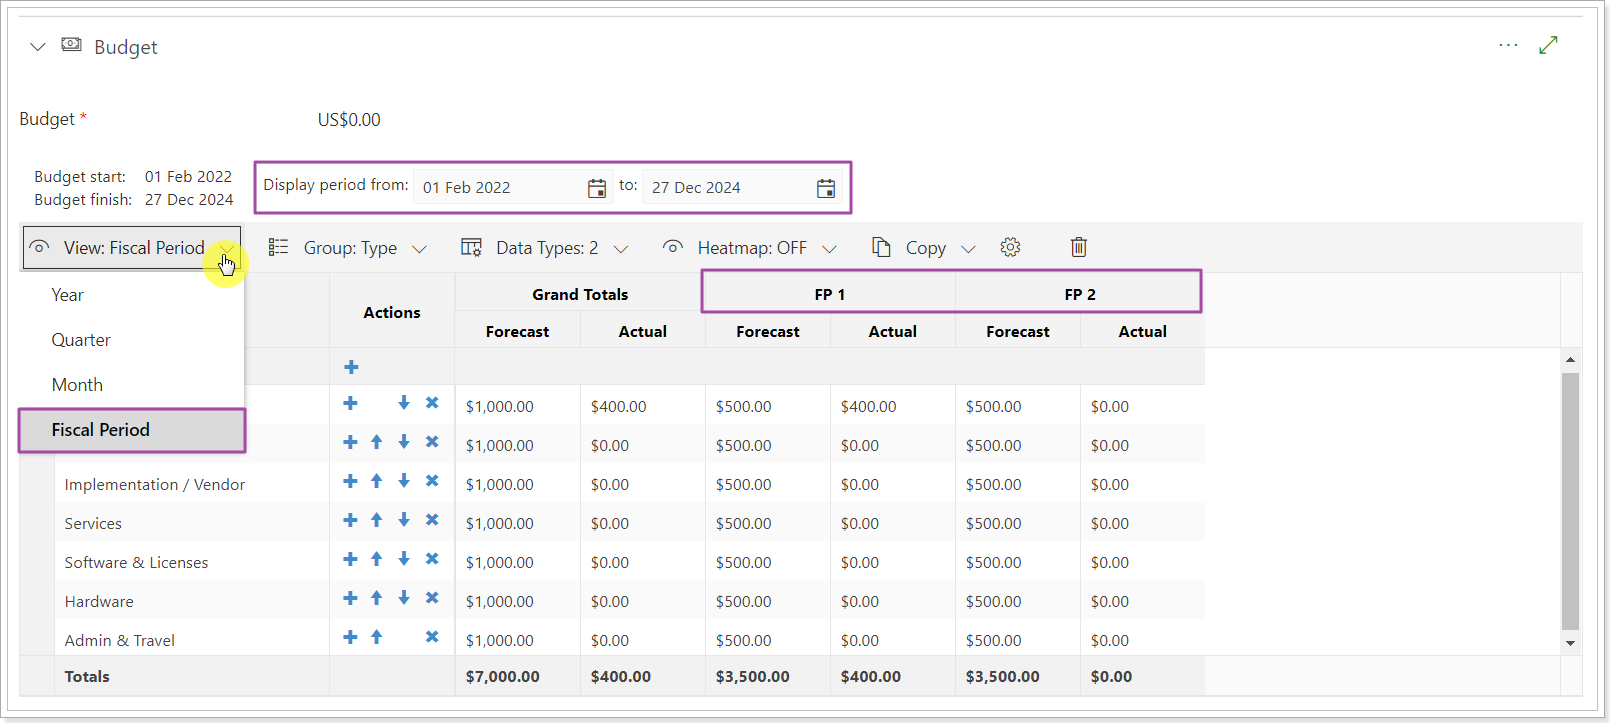
As you switch between different Views on the Budget Project section, you should take into account the calculation logic of Financial reports. The numbers in the Budget section are divided and counted per day. Thus, the numbers displayed may differ depending on the selected View.
If the number cannot be equally divided for selected days, the remainder of the division will be added to the last date of the selected period.
For example, you open Months View and type in 10,000$ for 'Actual' per month (30 days). Later you apply Fiscal Periods View where the Fiscal Period is 20 days. As a result, you will see the number for 'Actual' for 20 days, which is 6,666$ instead of 10,000$.