PPM Express provides a Governance Power BI pack.
In this article, we will give you a general overview and some tips on how to get the most out of it.
The Governance pack offers four reports: Portfolios Quality, Programs Quality, Projects Quality, and Resources Quality.
The goal of these reports is to identify those aspects of data entry that can potentially negatively influence decisions. In reports, such aspects are presented as data quality metrics grouped around Portfolios, Programs, Projects, Tasks, and Resources data.
A typical pack report contains three main elements:
- A table where for each entity item, the value of its data quality metrics is calculated.
- Bar chart showing the number of entity items broken down by data quality metrics.
- Quality metric slicer filtering table (1) and chart (2).
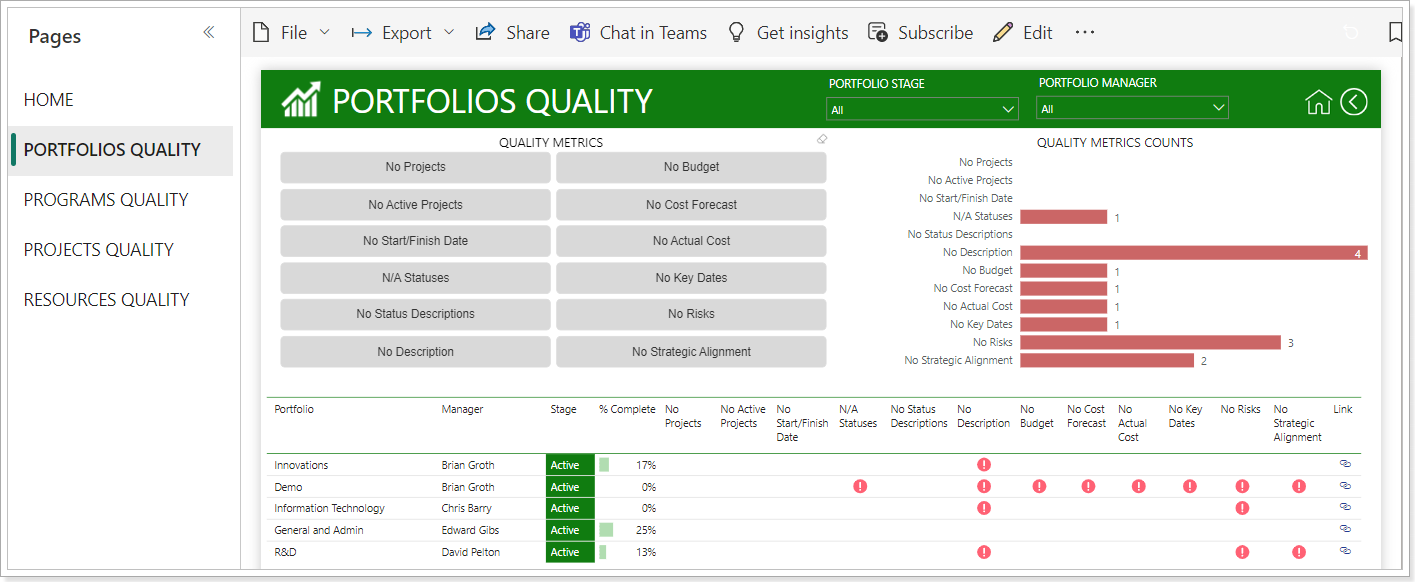
Quality metric slicer and table headers display short names of data quality metrics. An extended description of the metrics is displayed in the tooltip when you hover the mouse over the corresponding icon.
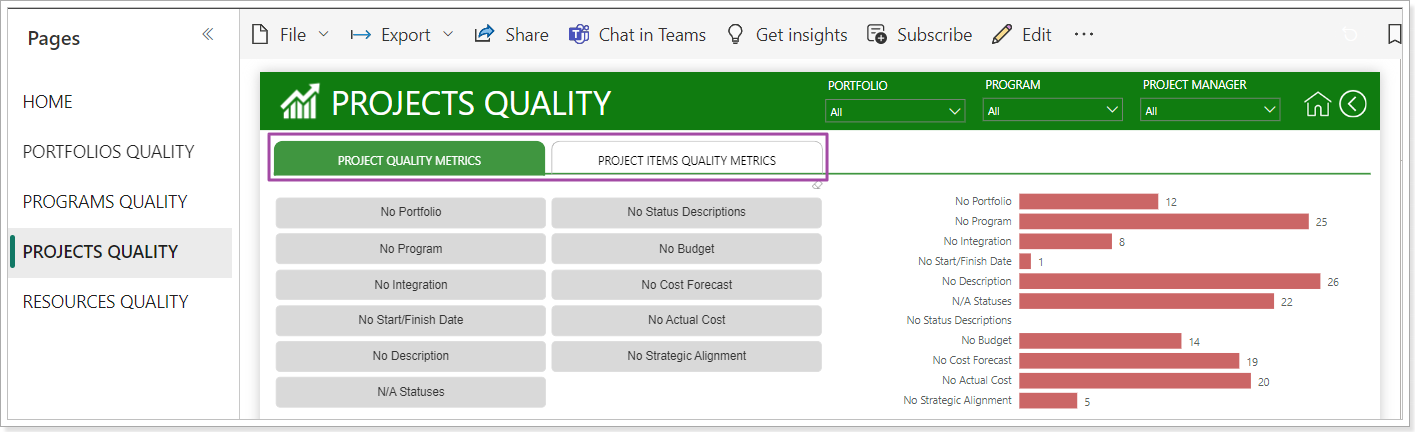
In the 'Projects Quality' and 'Resources Quality' reports, data quality metrics are grouped into tabs. On the first tab, there are metrics related only to the entity in question, on the second one, metrics that also affect other related entities:
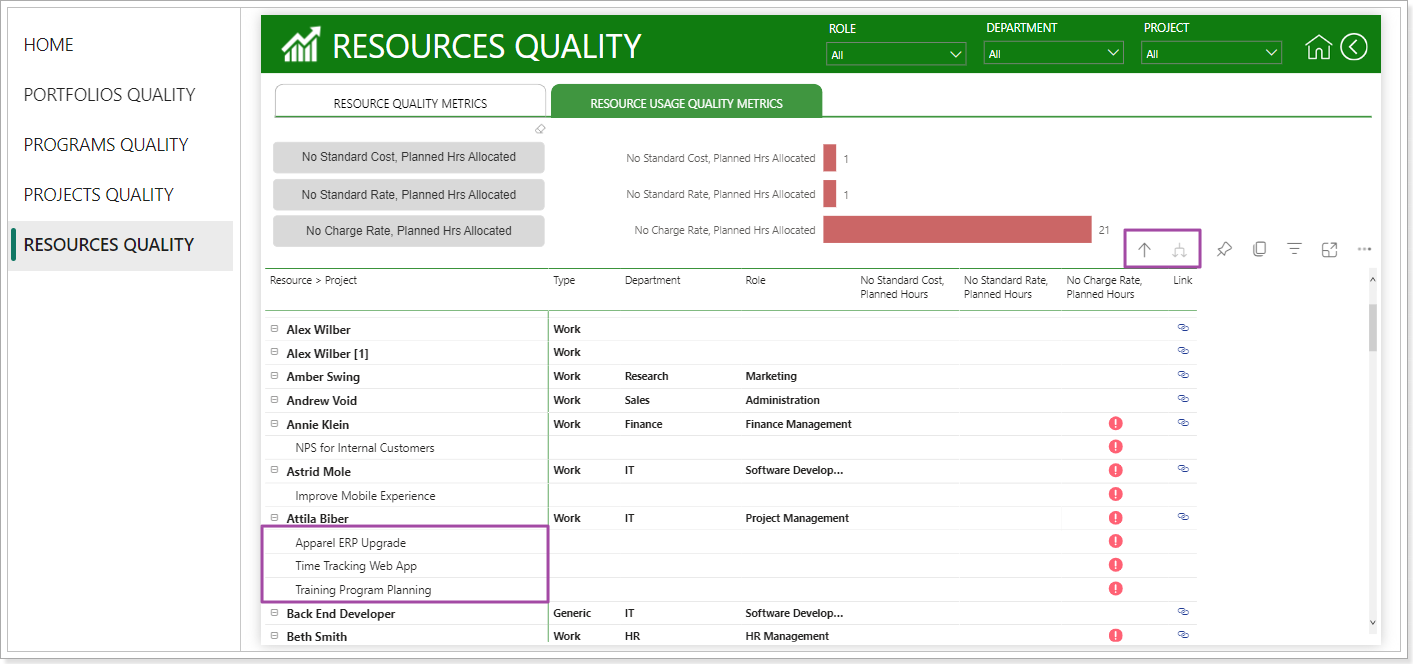
For example, Resource Usage Quality Metrics are calculated for resources that have Planned Hours on certain projects:
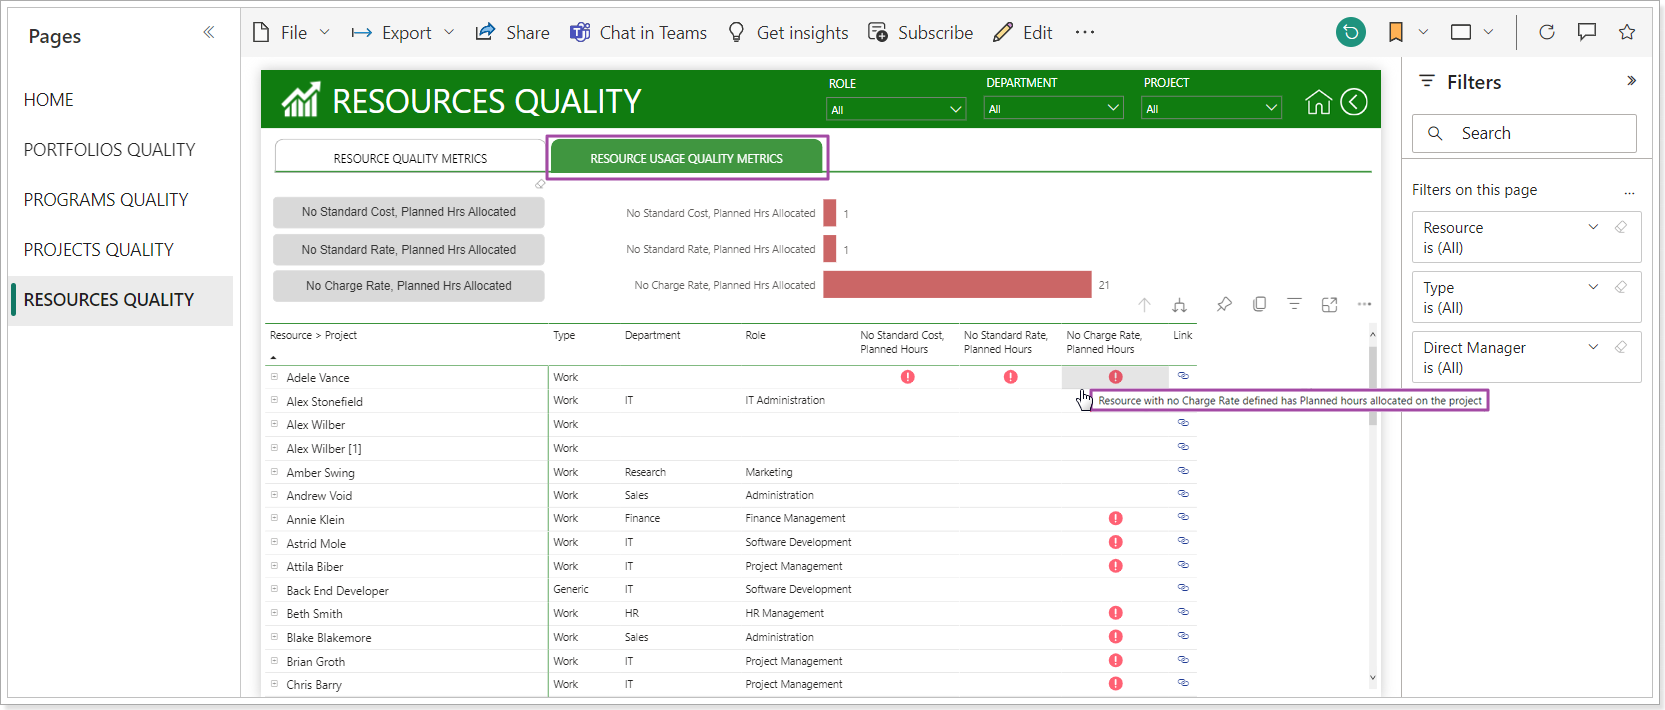
Use the hierarchy display controls to see the related projects:
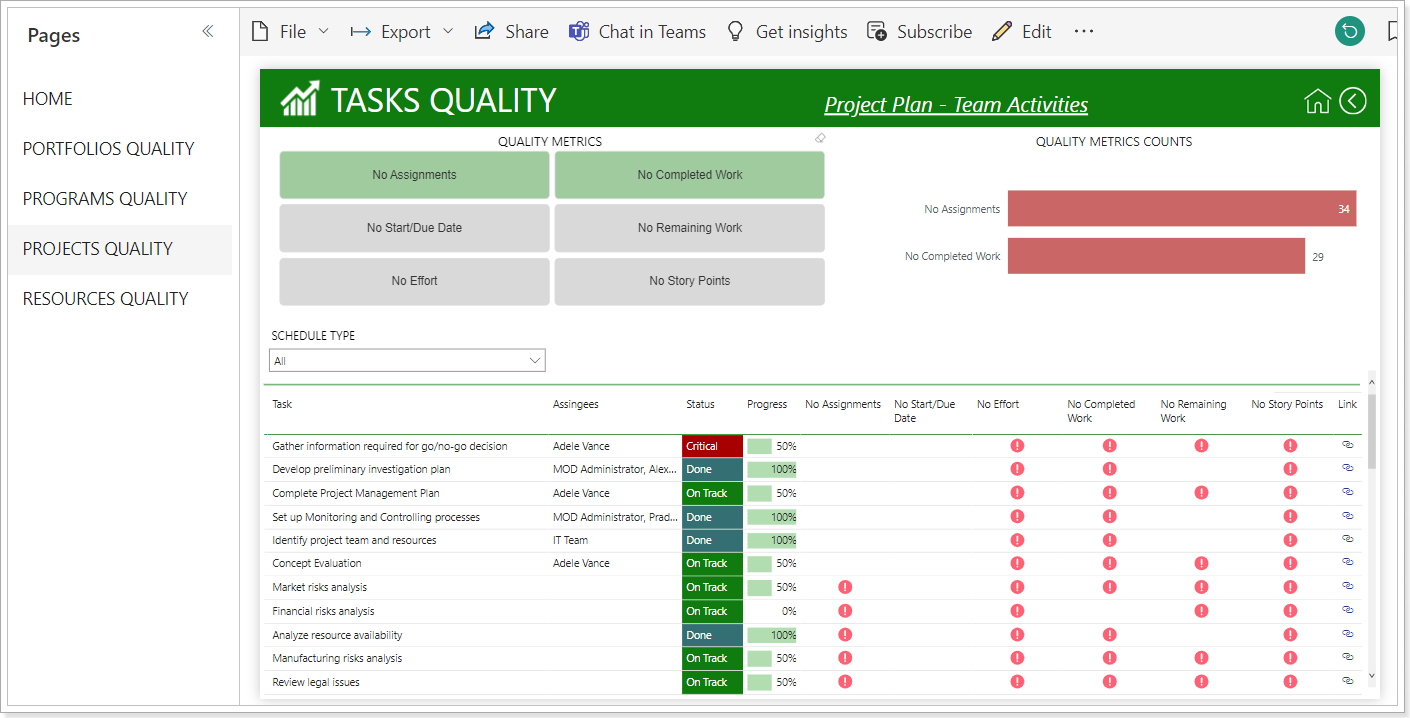
In the Projects Quality report, use the ‘Drill through’ option to open the Task Quality report:
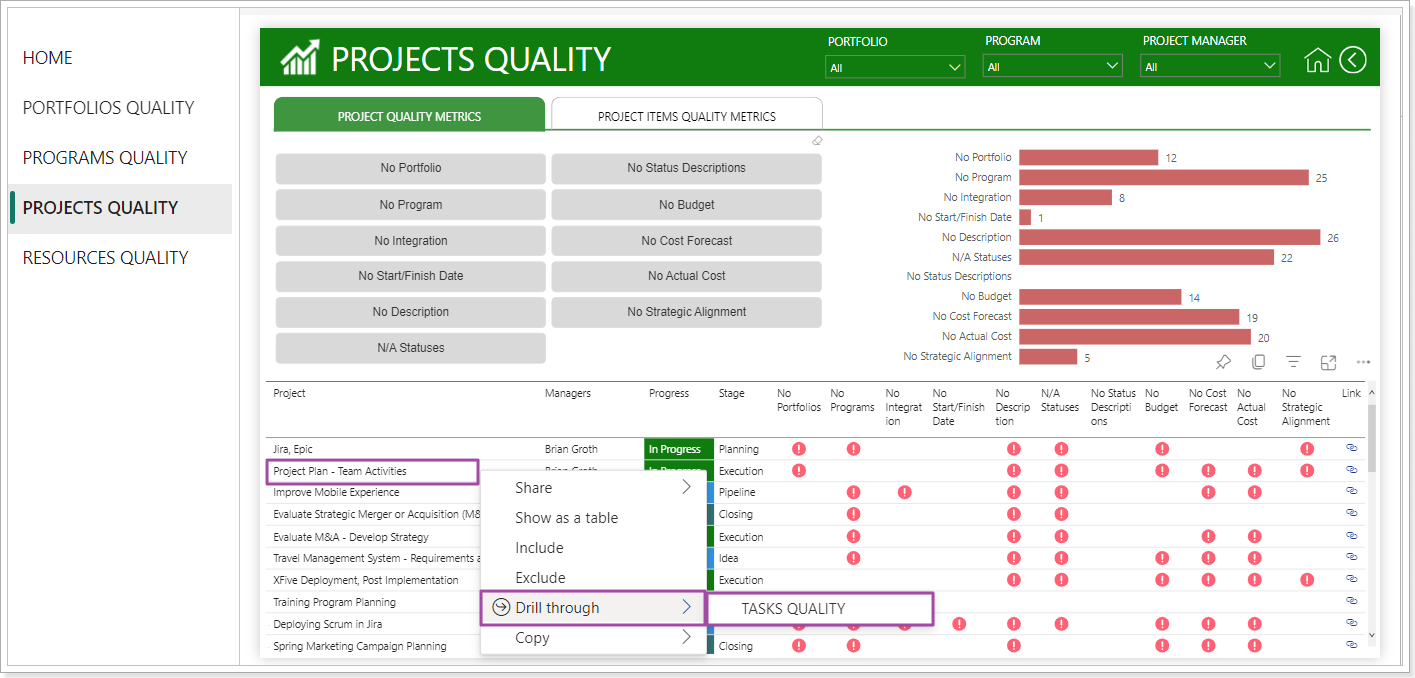
The Task Quality report opens task analysis.