PPM Express provides an Innovation PPM Express Power BI pack.
The Innovation Report Pack has all the needed tools to review detailed information about your Business challenges and Ideas. This report is excellent for presentations within your company as it includes visuals that allow you to quickly get information for the usage, statuses, top items by different criteria, etc. of your Challenges and Ideas.
In this article, we will give you a general overview and some tips on how to get the most out of it.
The Home page opens access to the main reports of the Innovation pack, but overall there are more reports than you can see on the home page and we will review how to open them all.
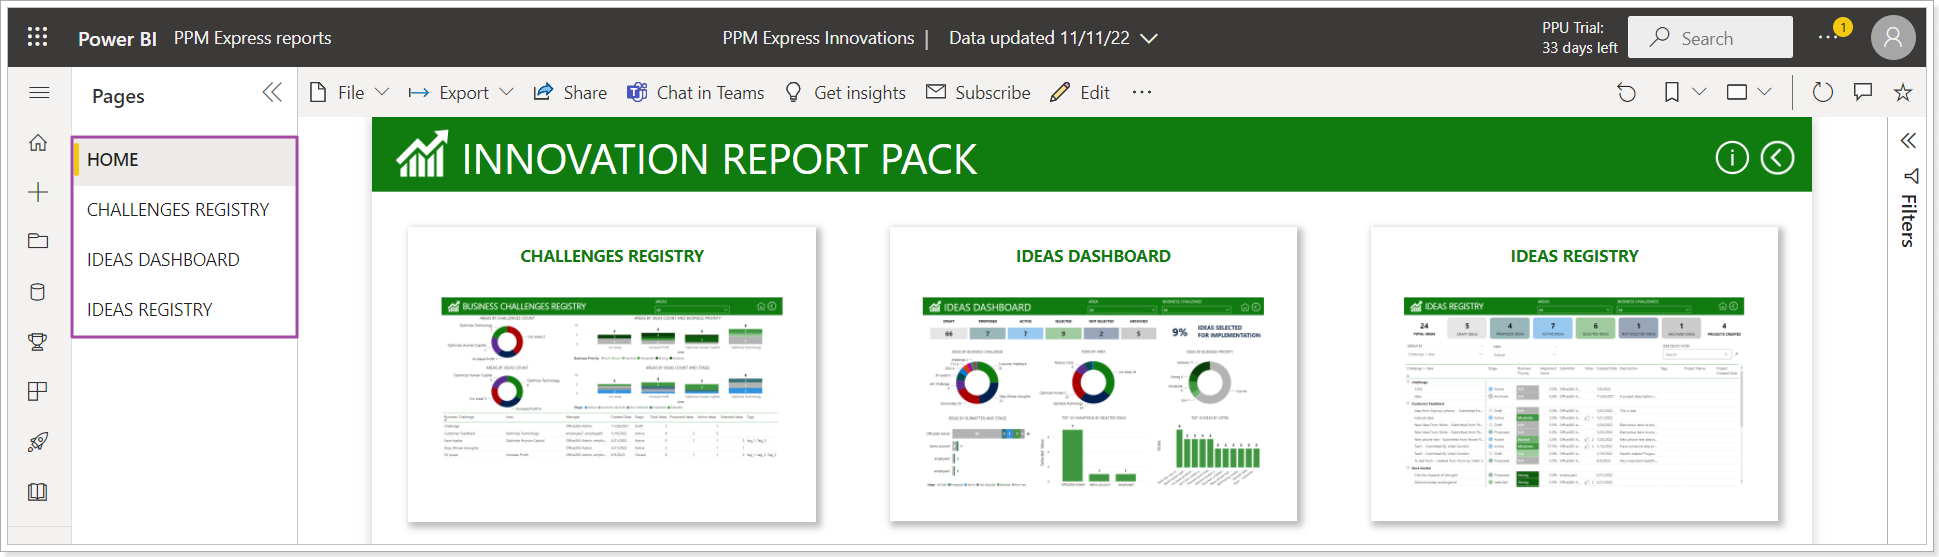
All reports are interactive. Data visualization depends on the applied filters. For your convenience, the most popular filters are located on the report canvas, the rest are placed on the filter panel.
Also, the visuals are clickable and allow sorting the information displayed accordingly.
Business Challenges Registry Report
The purpose of the report is to present a register of challenges for analysis.
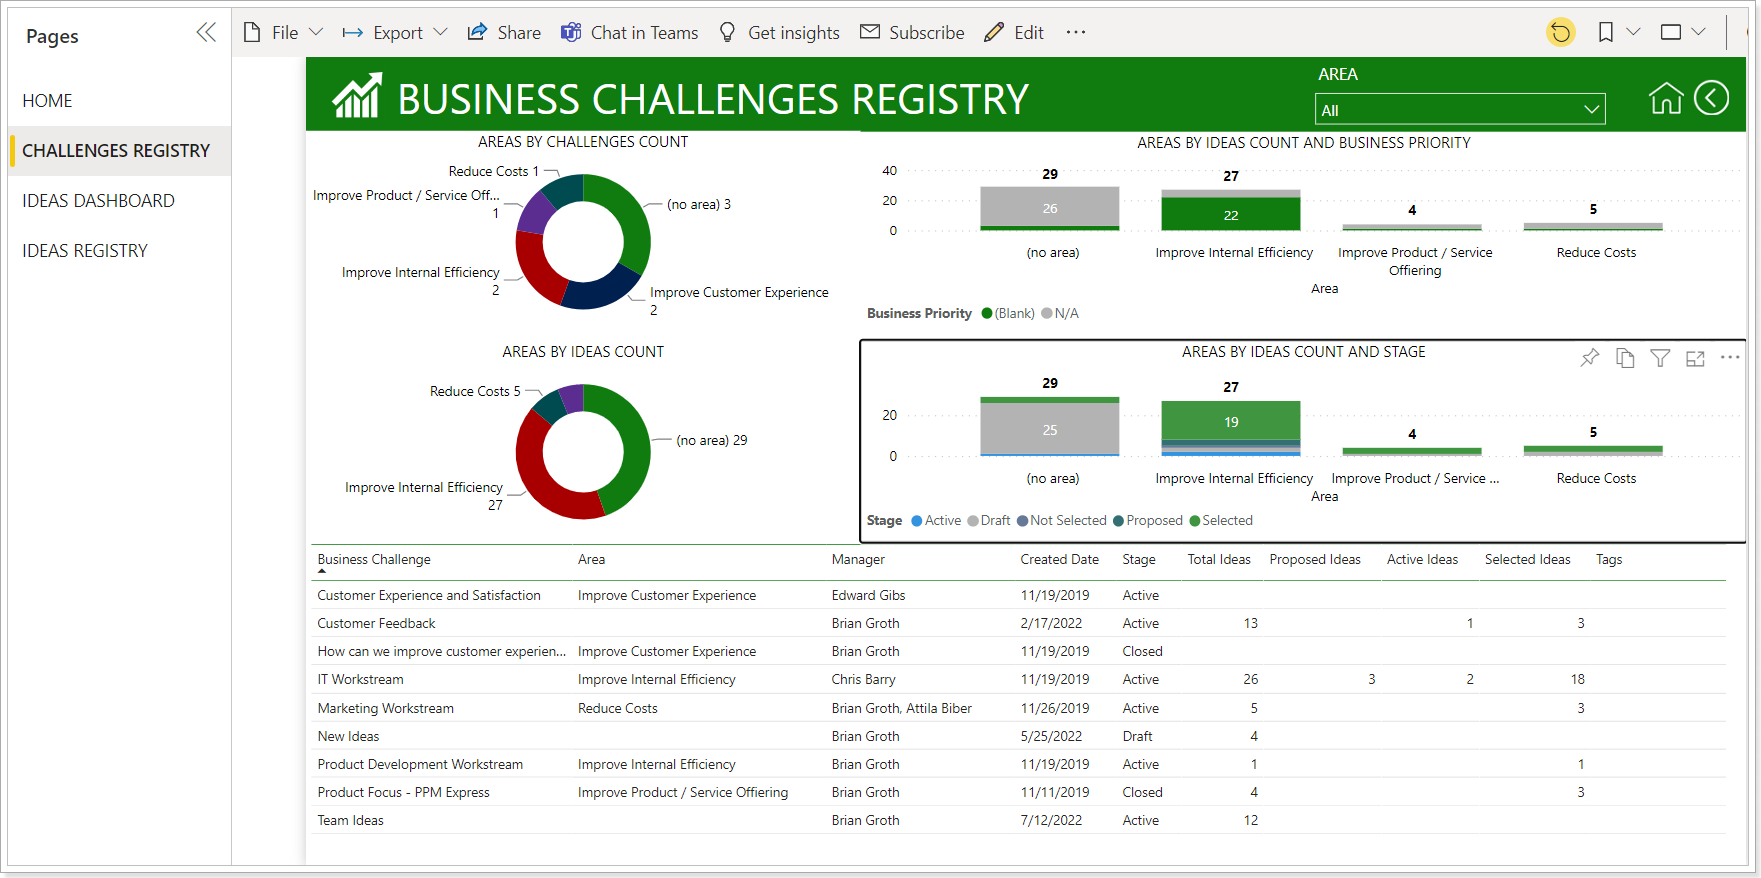
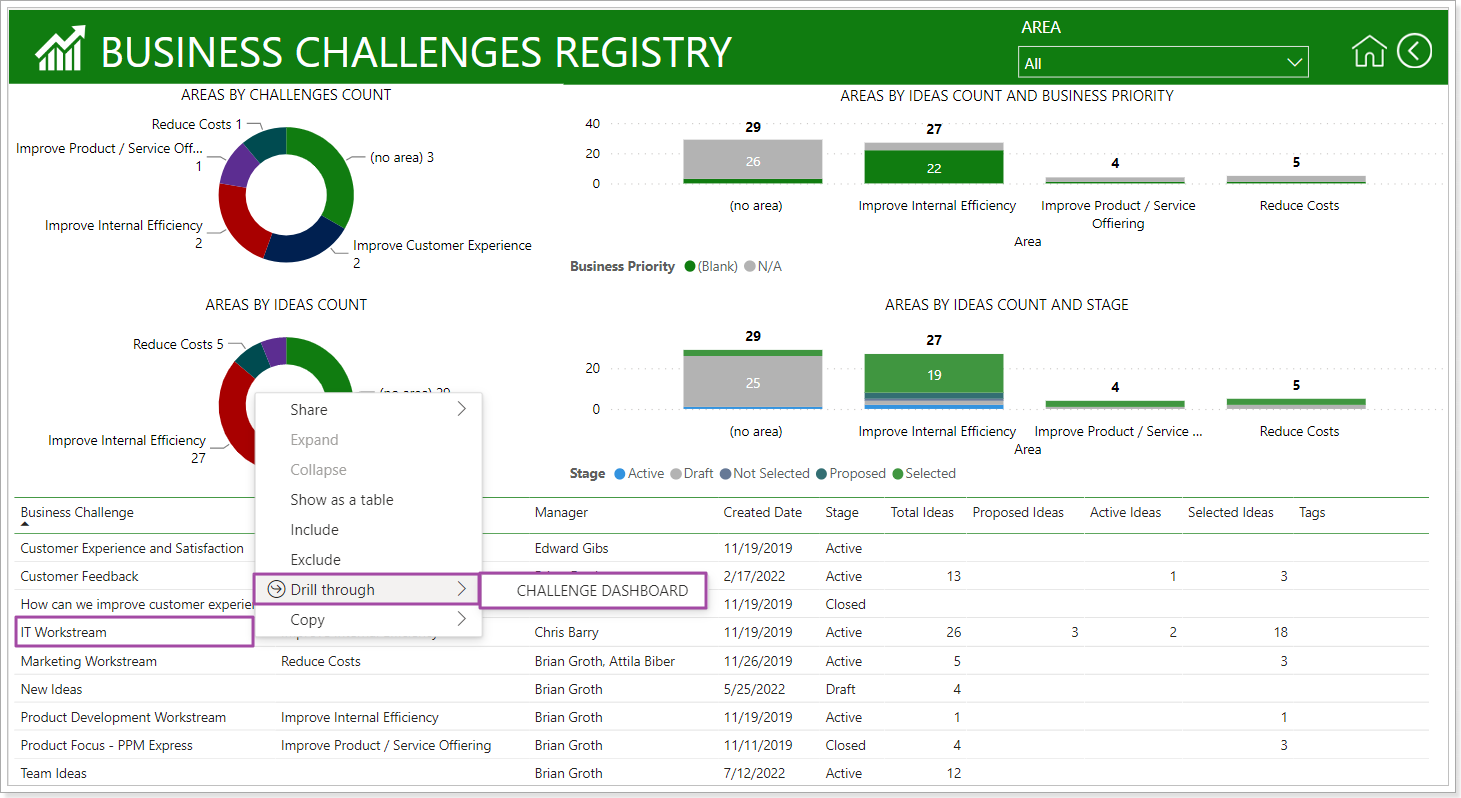
To study analytics within a particular dashboard, it is necessary to right-click on the business challenge to drill through to the corresponding dashboard.
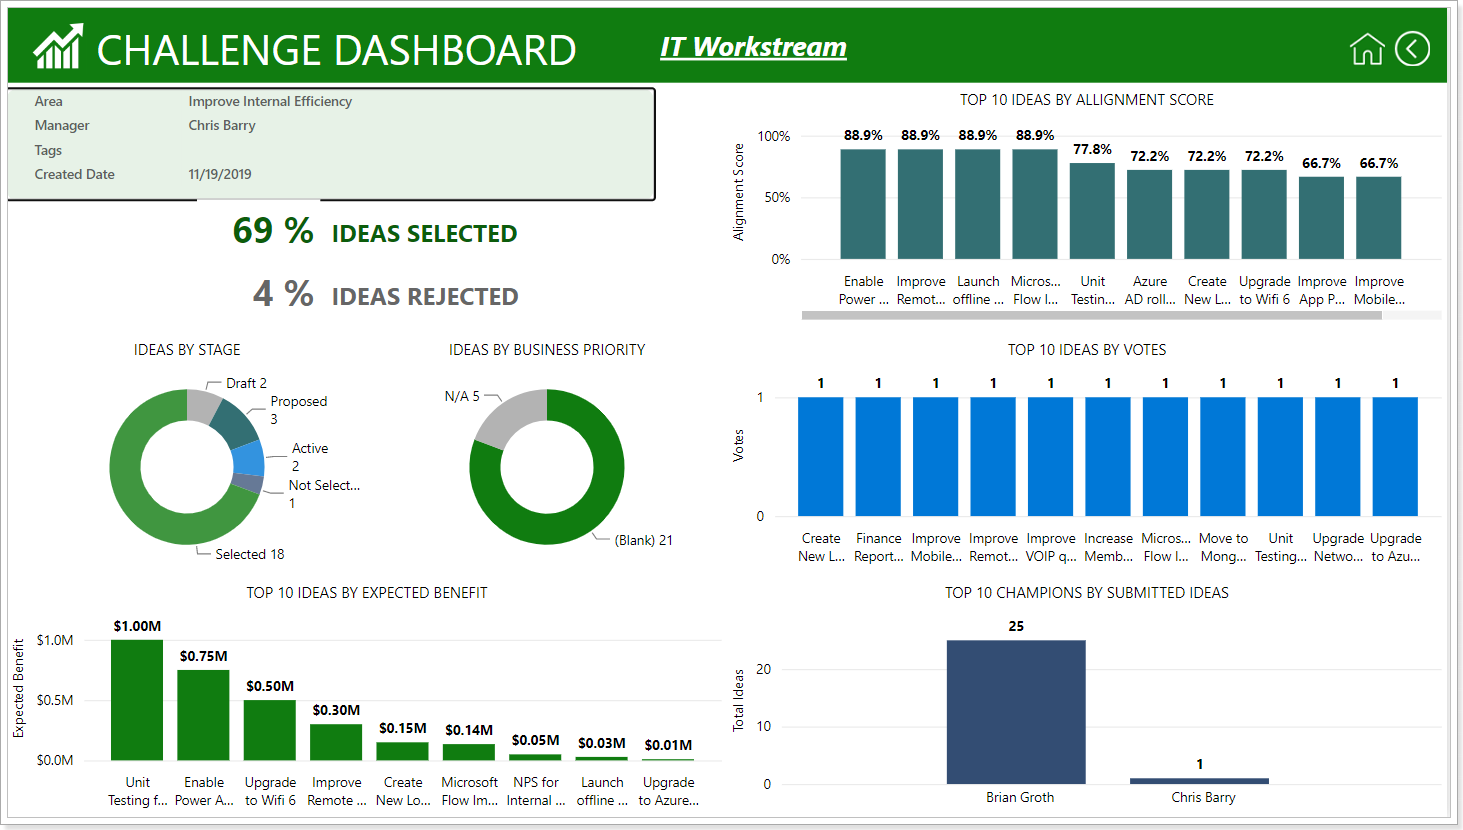
The Challenge Dashboard, along with the details of the selected challenge, contains charts for analyzing various aspects of its ideas.
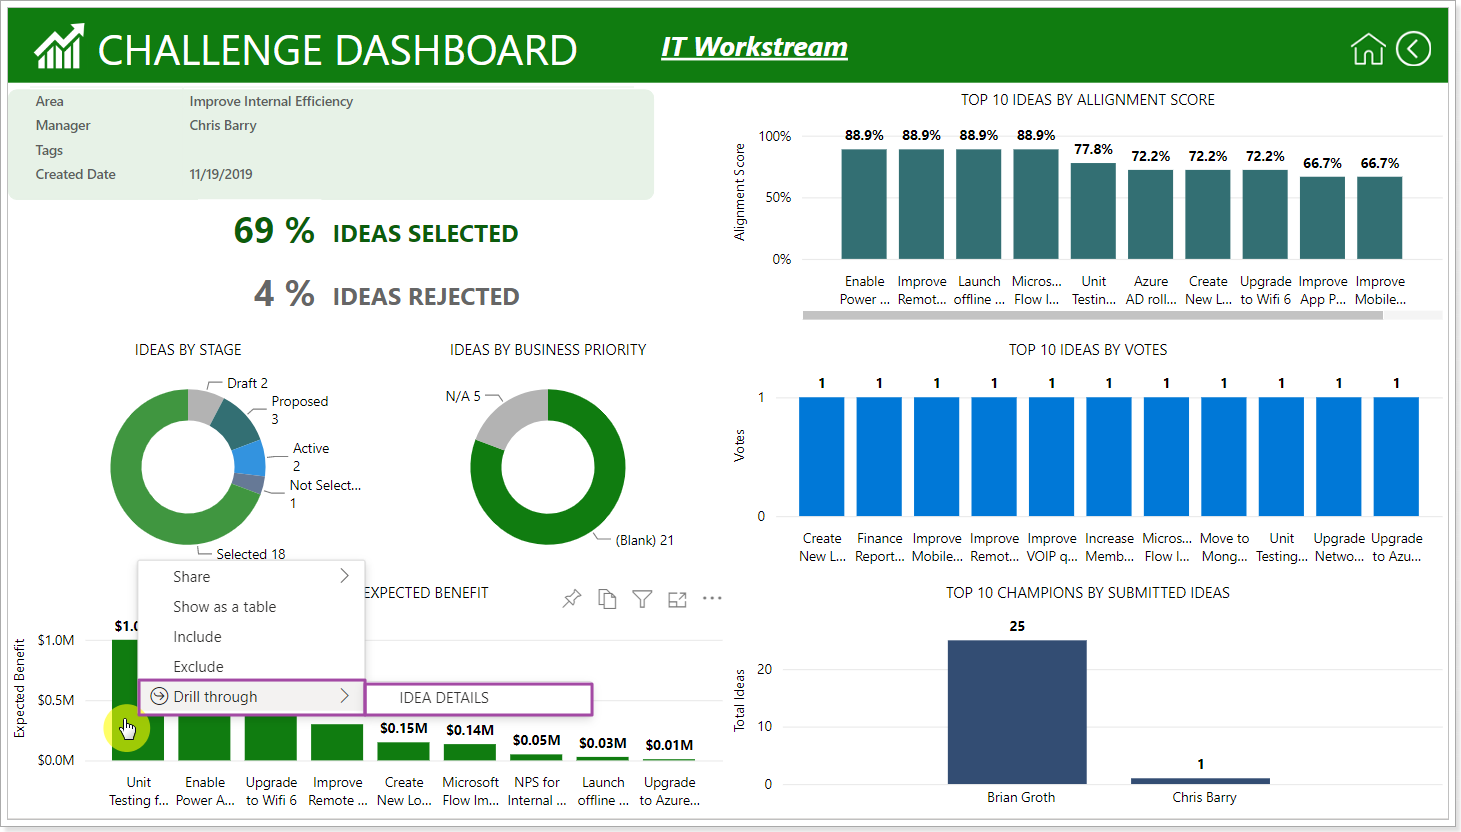
If you need to go to the details of an idea, you can right-click on a chart data point and then drill through to the Idea Details report.
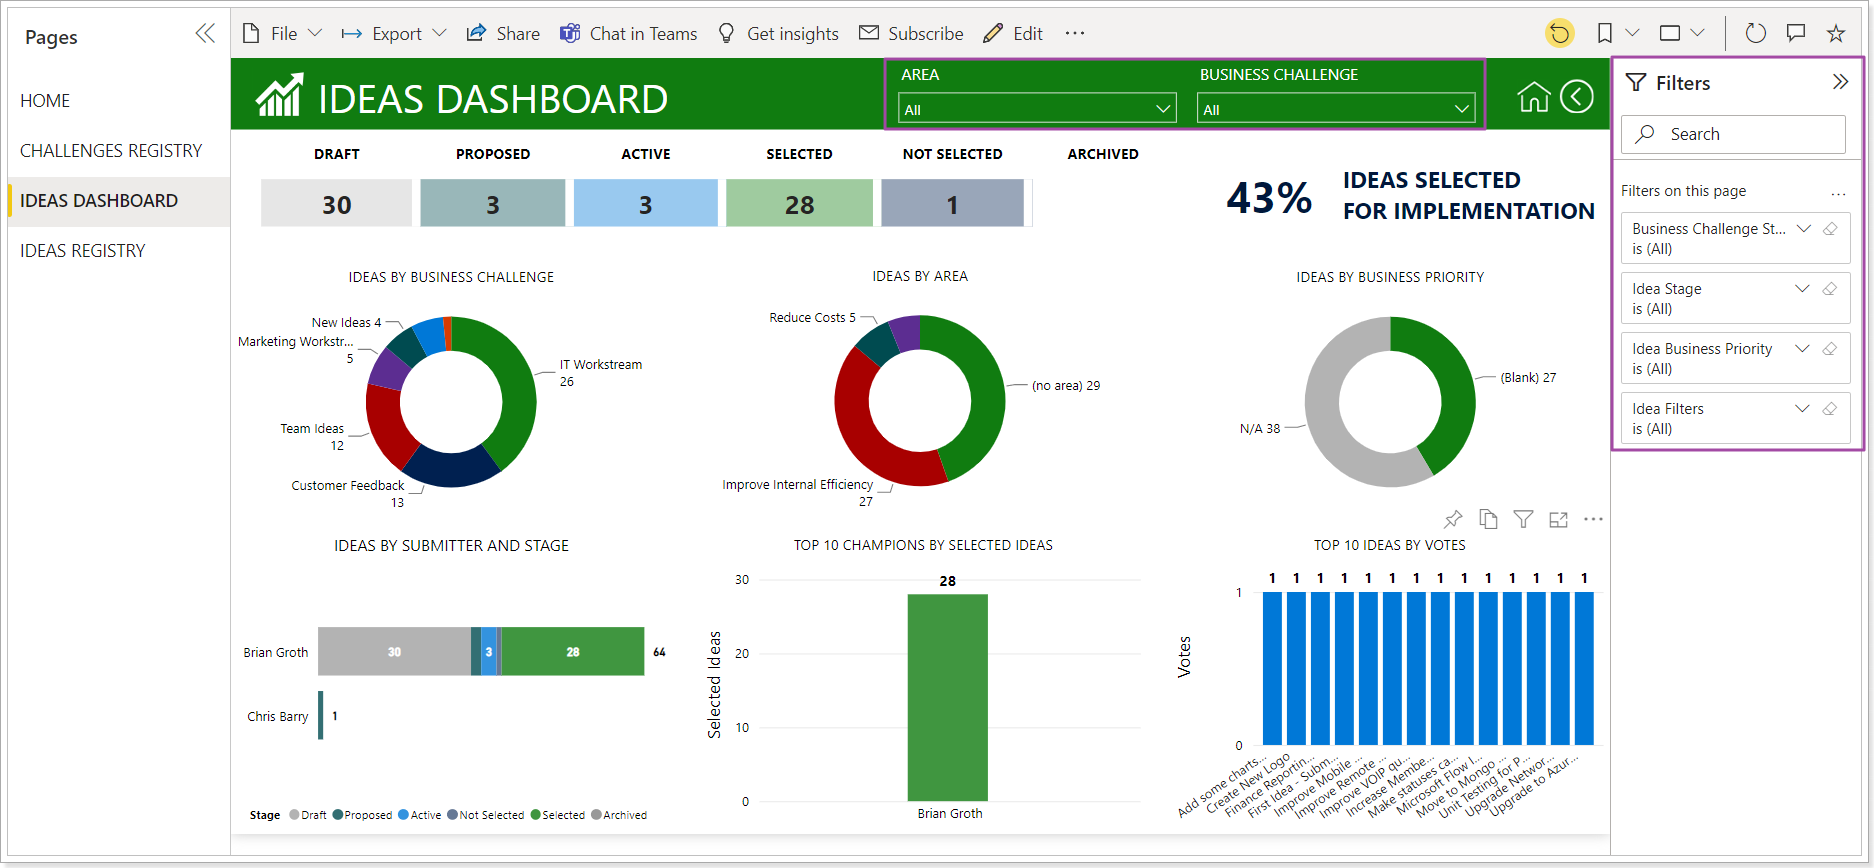
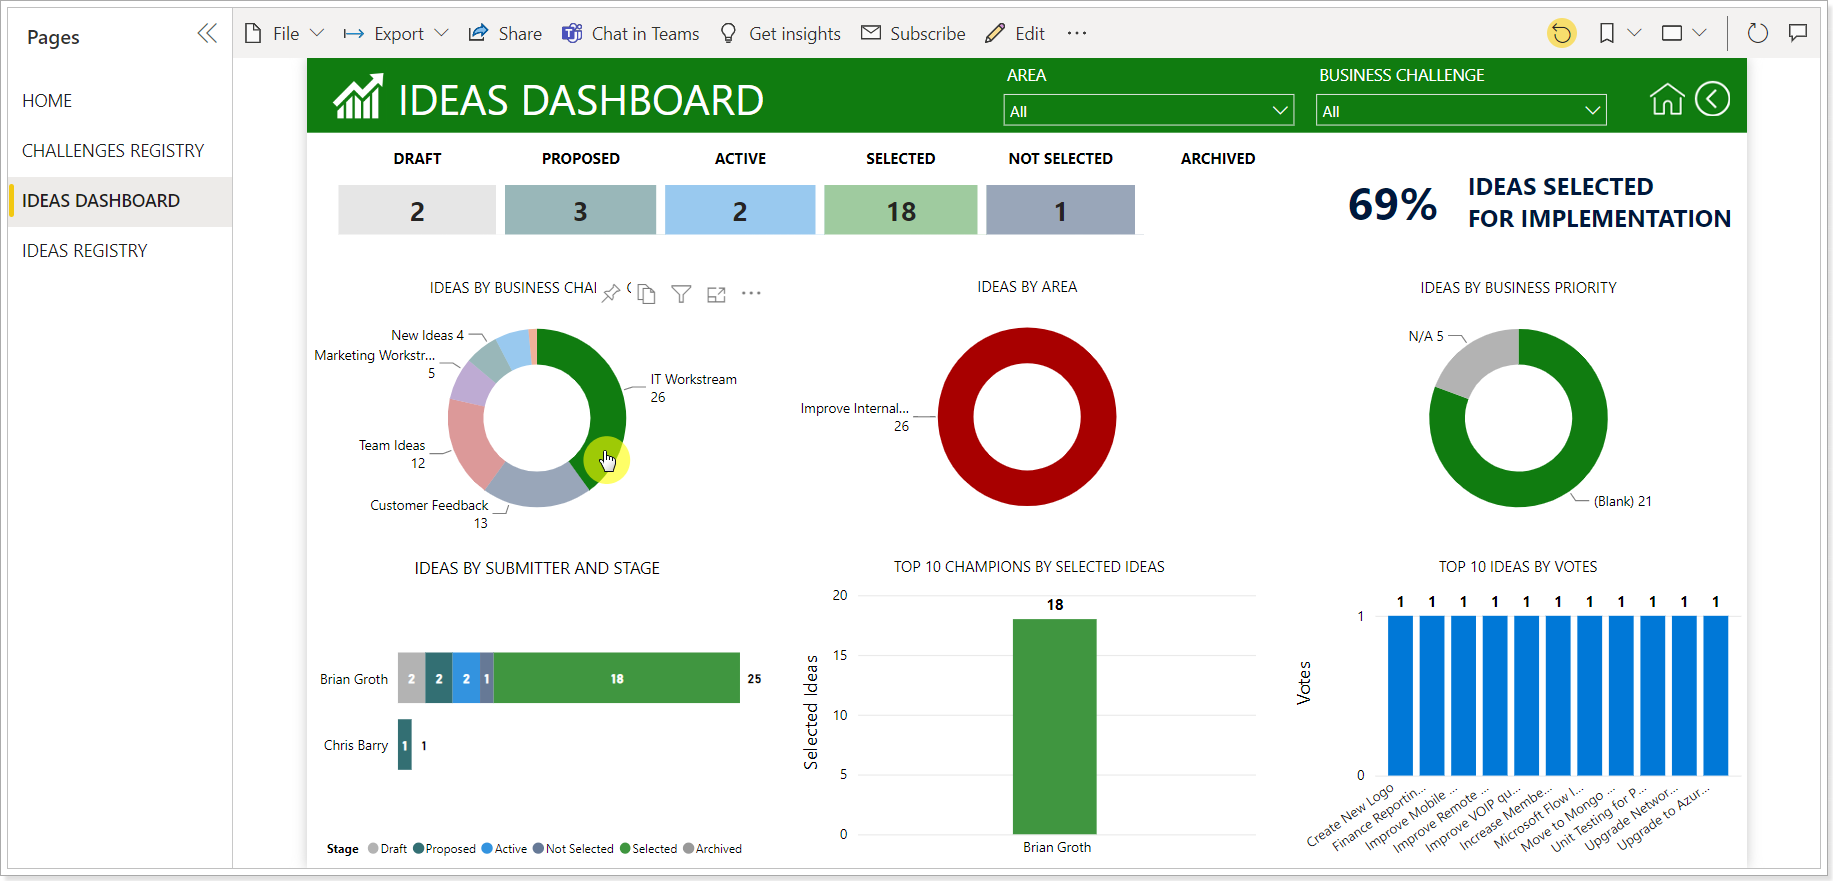
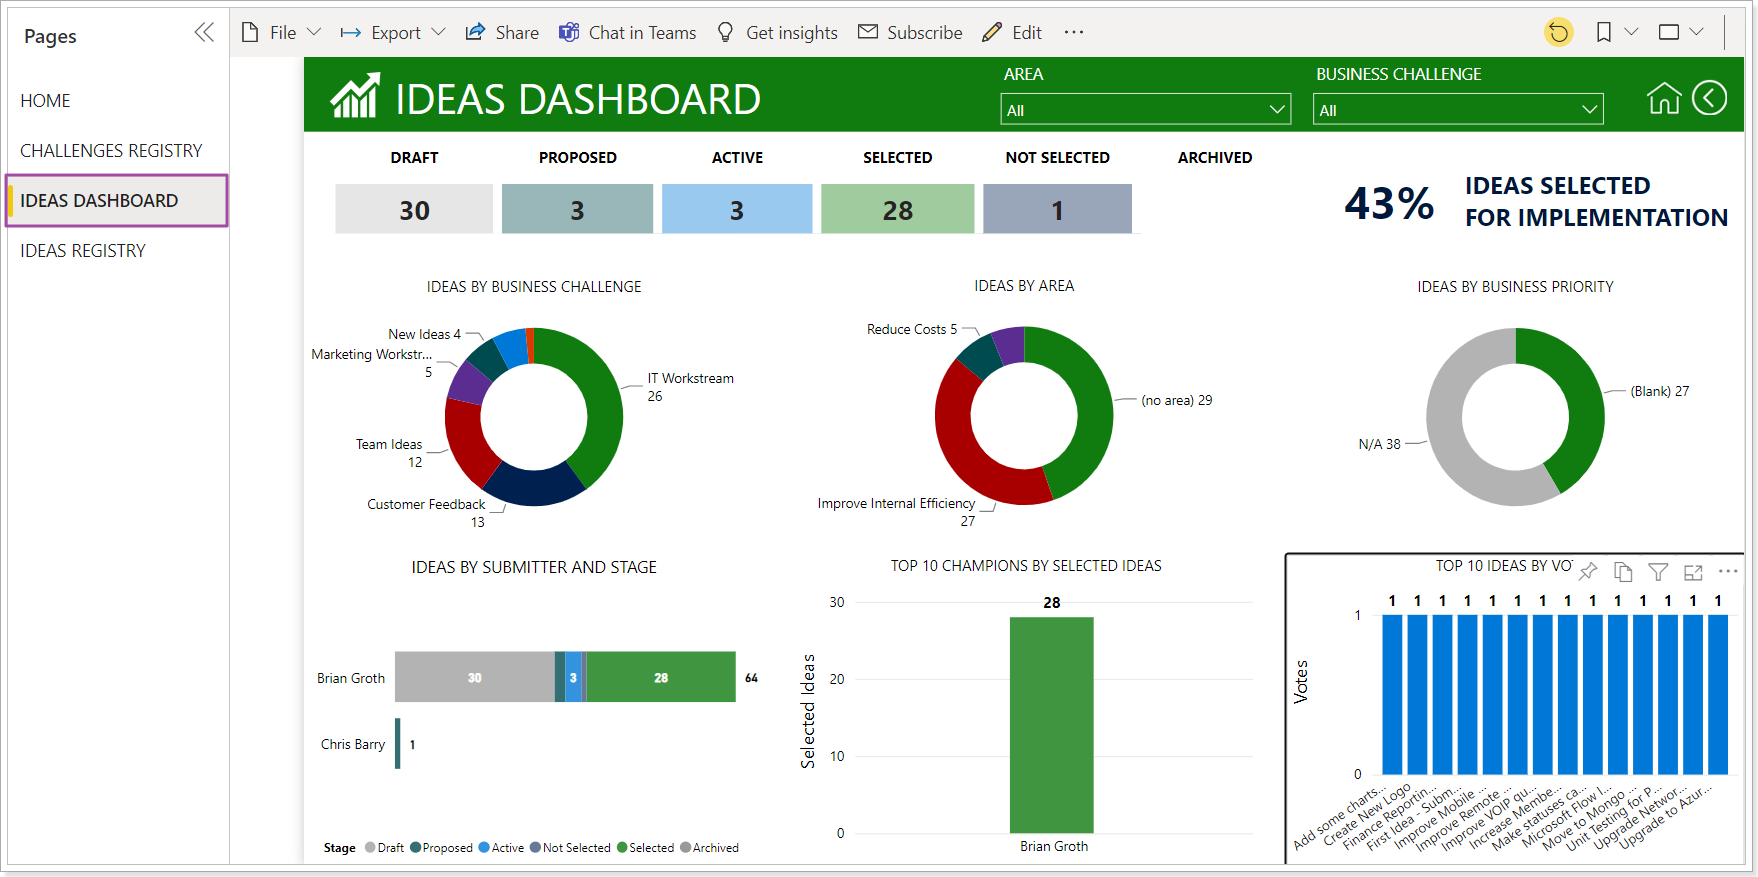
Ideas Dashboard report
The report tracks ideas progress allowing cross-challenge analysis. Unlike the Challenge Dashboard, where analysis is possible only within the framework of the selected challenge, here analysis is possible according to all the ideas of the tenant independently of the challenges they belong to.
To filter the ideas that any of the indicators rely on, you need to right-click on the data point of interest.
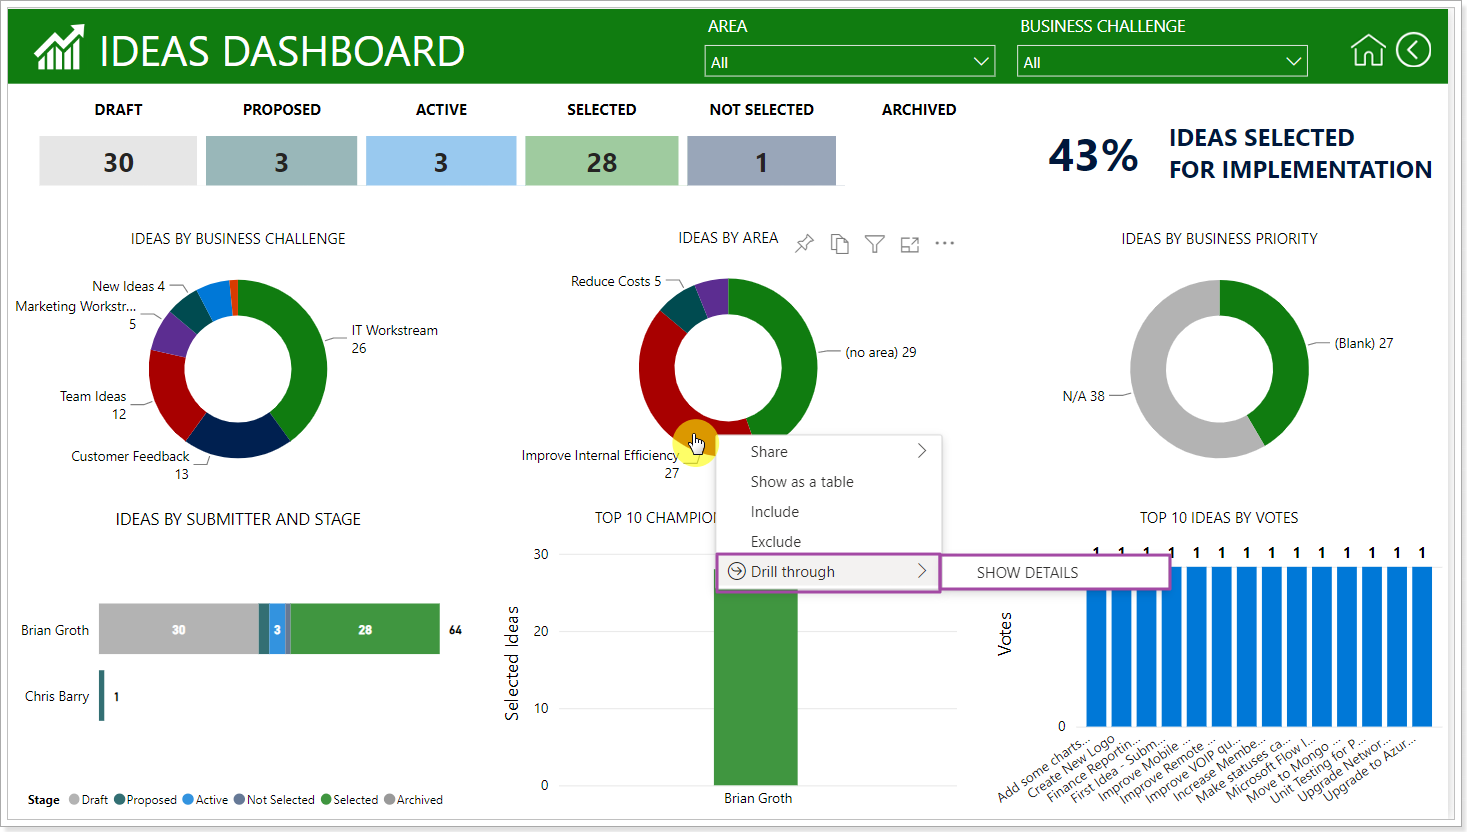
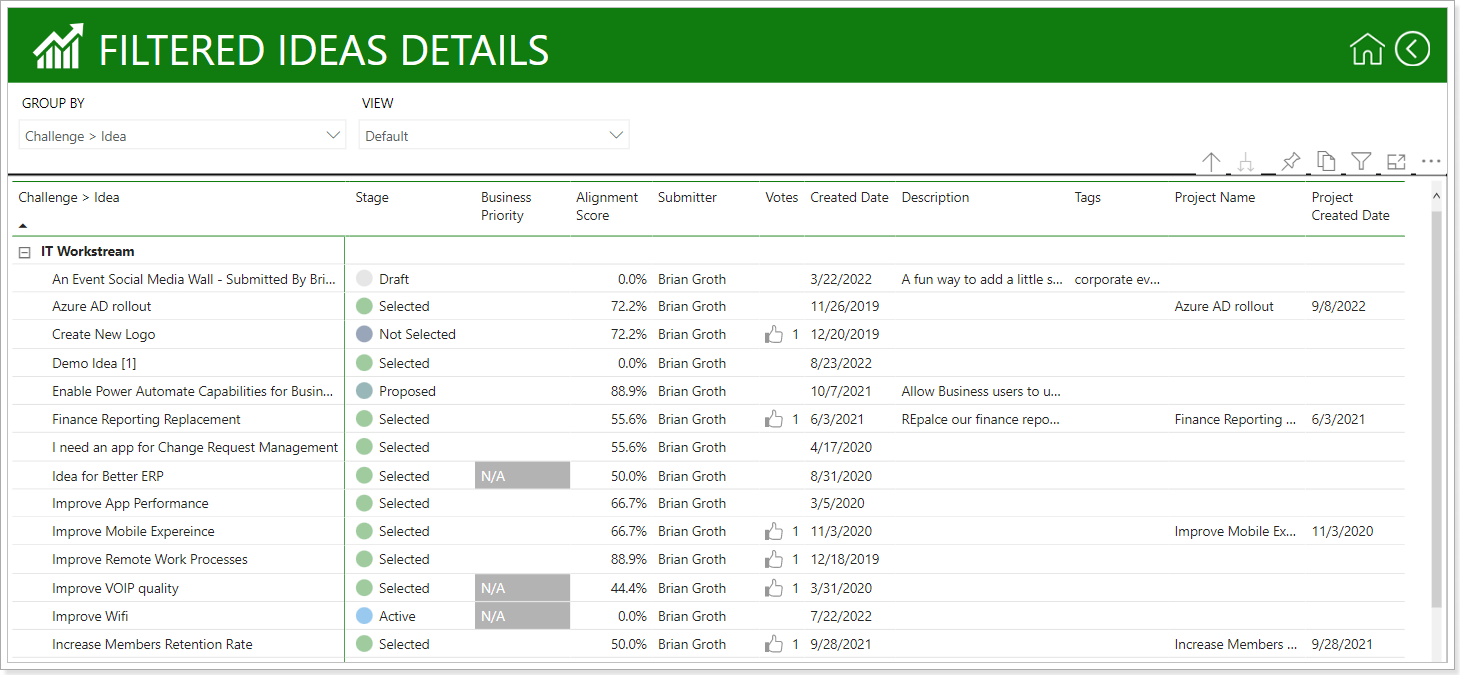
The result will be presented in the form of a table.
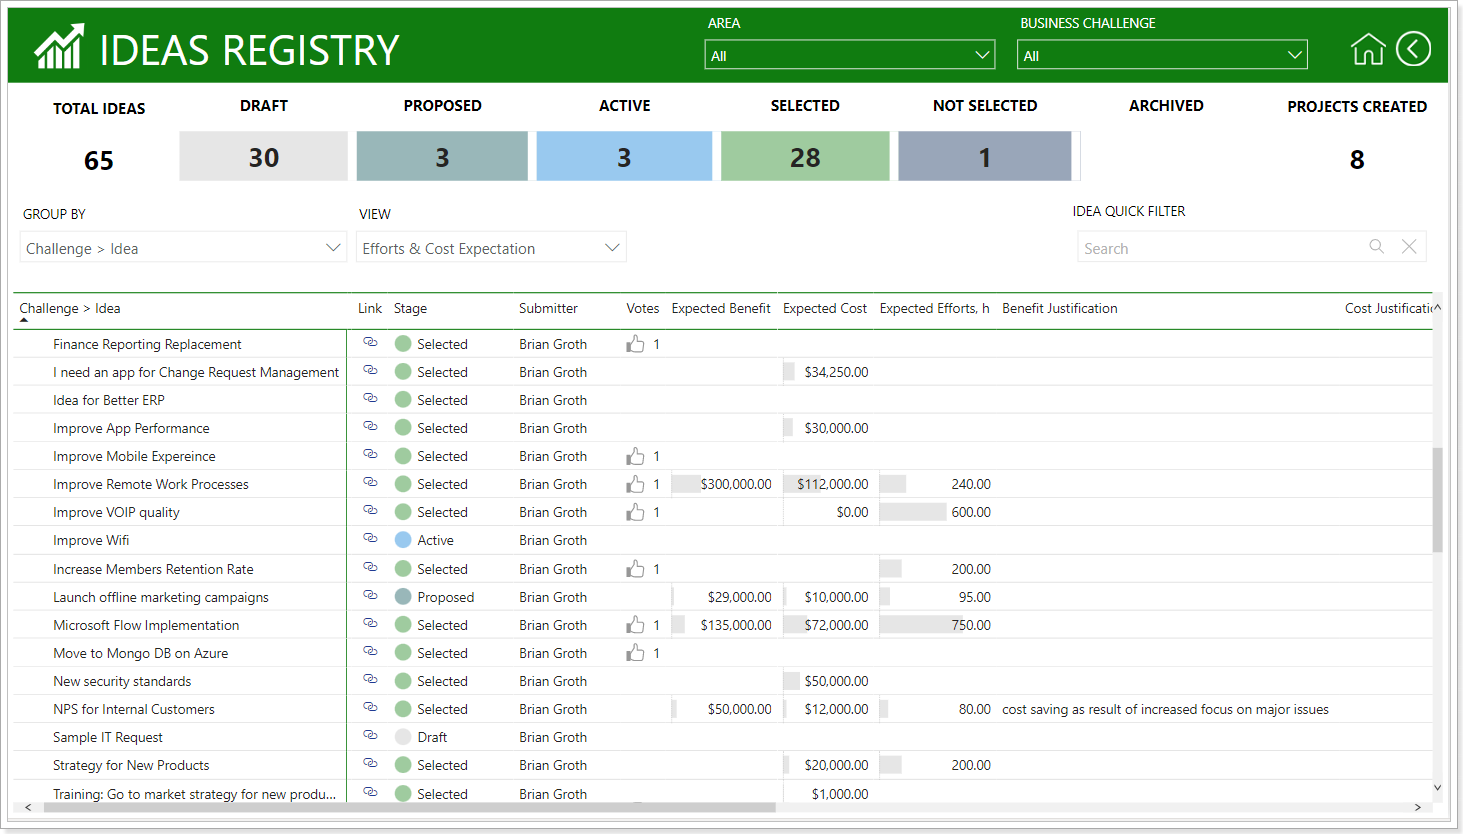
Idea Registry Report
The registry is represented by a list of ideas with multiple filtering and search options.
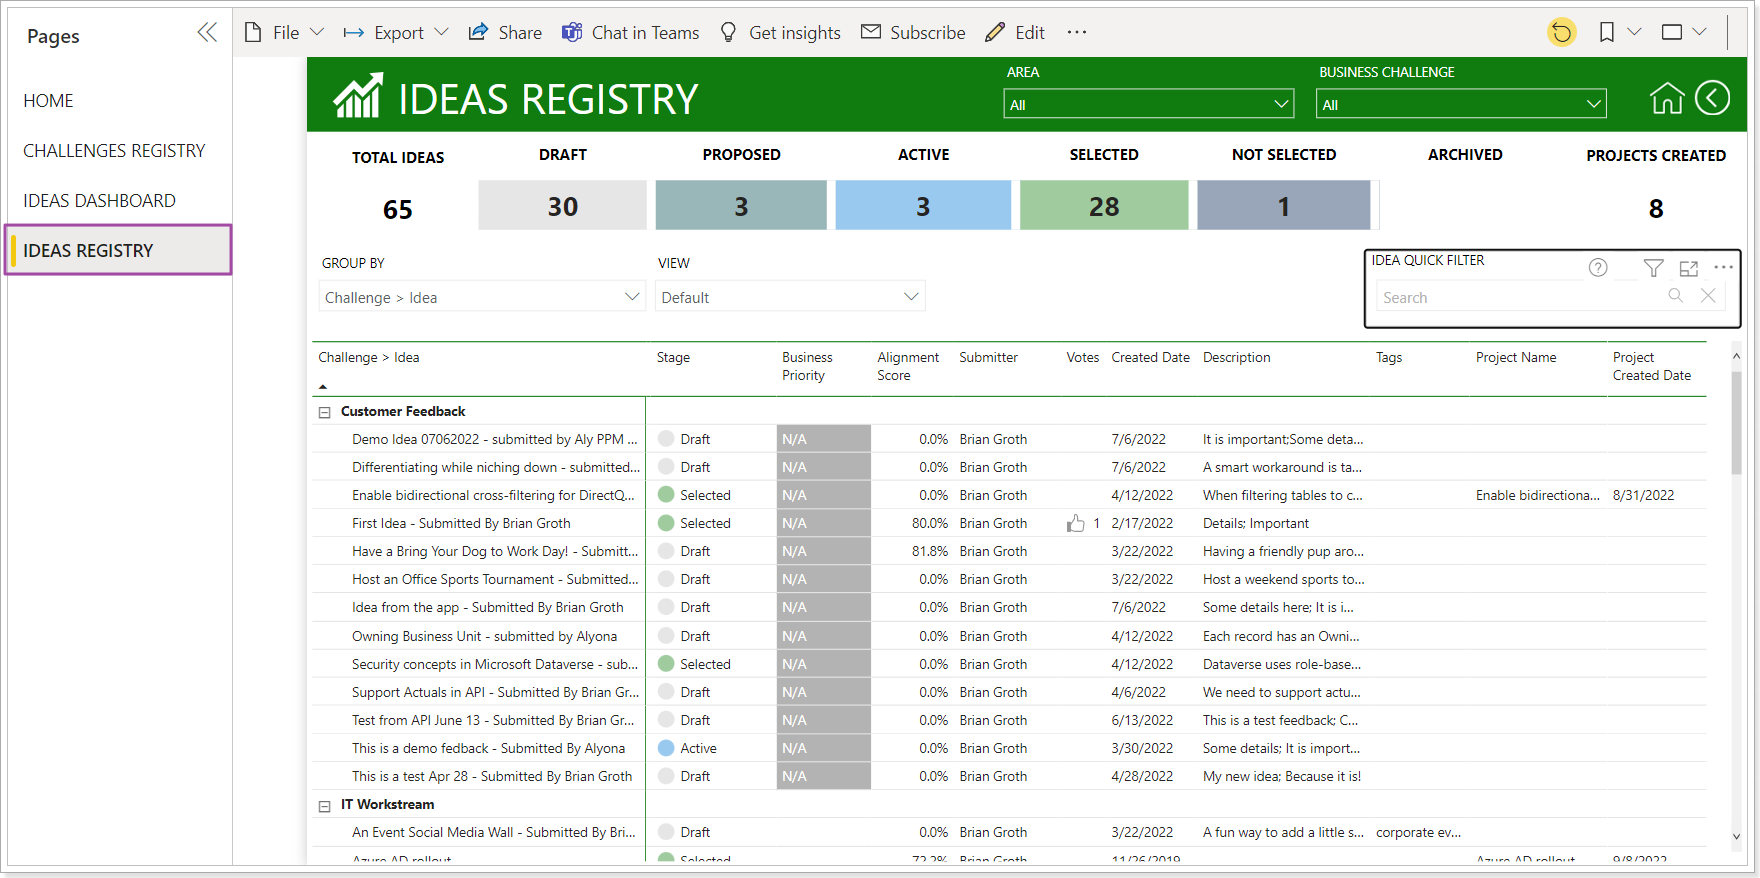
As in other reports, filtering is possible using filters placed on both the report canvas and the 'Filters' pane.
Clicking on idea counters allows you to narrow the list of ideas accordingly.
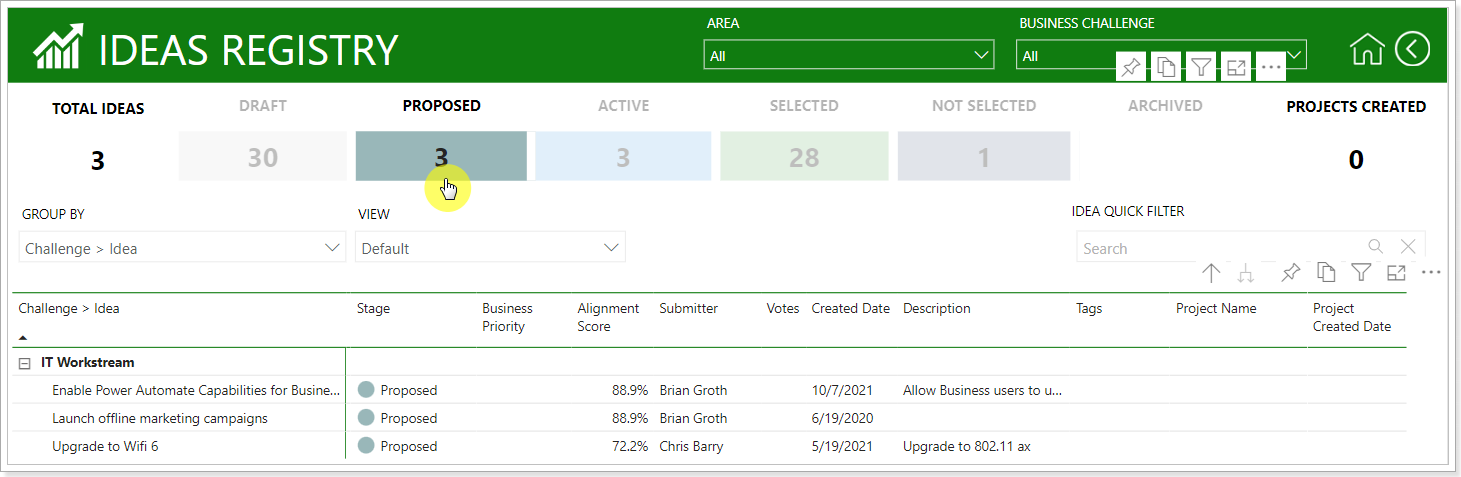
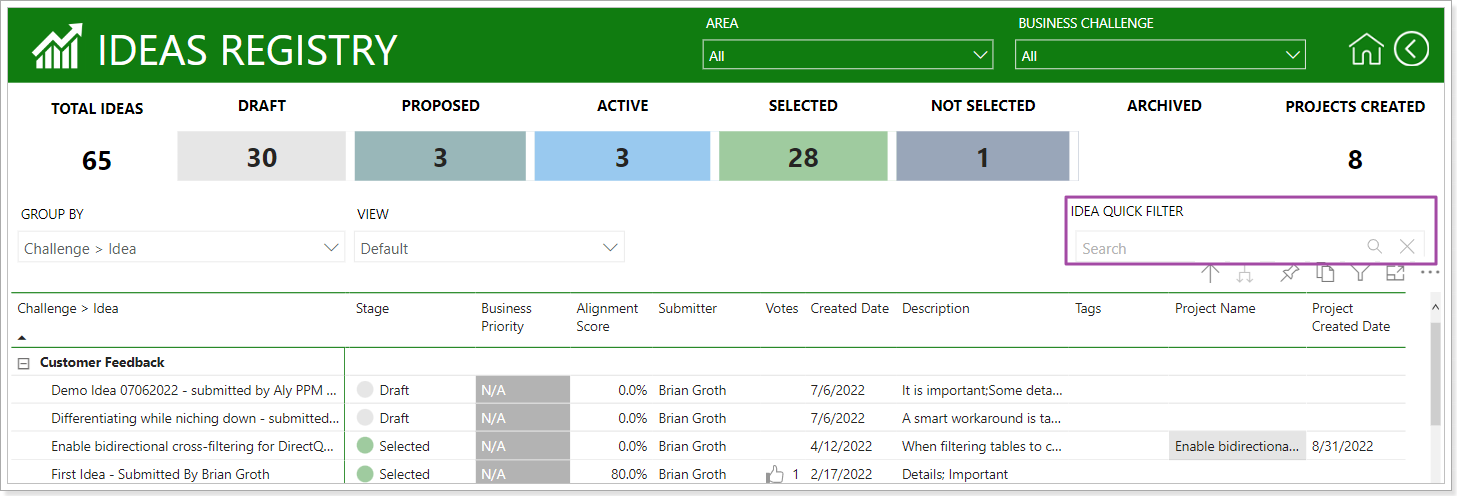
The quick search filter functionality allows you to filter ideas by several fields at once: Idea Name and Idea Tags.
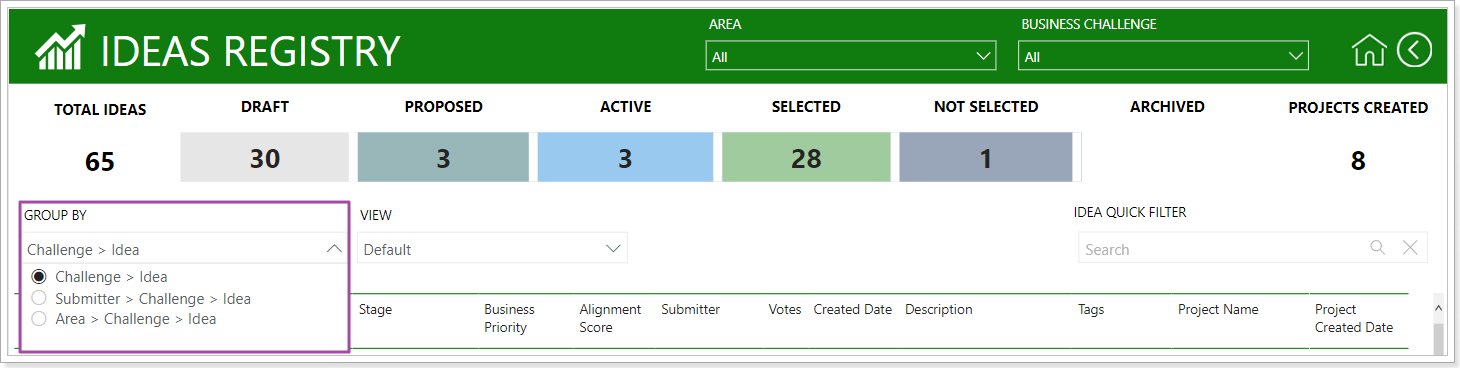
The registry is represented by a list of ideas, with the possibility of grouping in one way or another.
By default, the list of ideas has the following grouping: Challenge -> Idea
The grouping method can be changed by selecting the desired one from the list:
The default set of displayed columns can also be changed to one of the following.
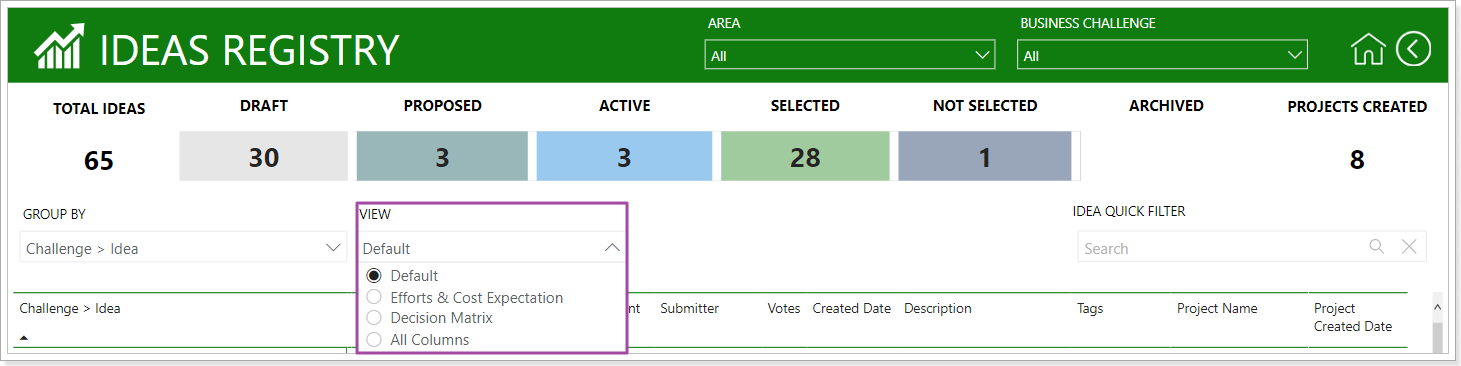
For example, selecting 'Effort & Cost Expectation' will display the corresponding view columns.
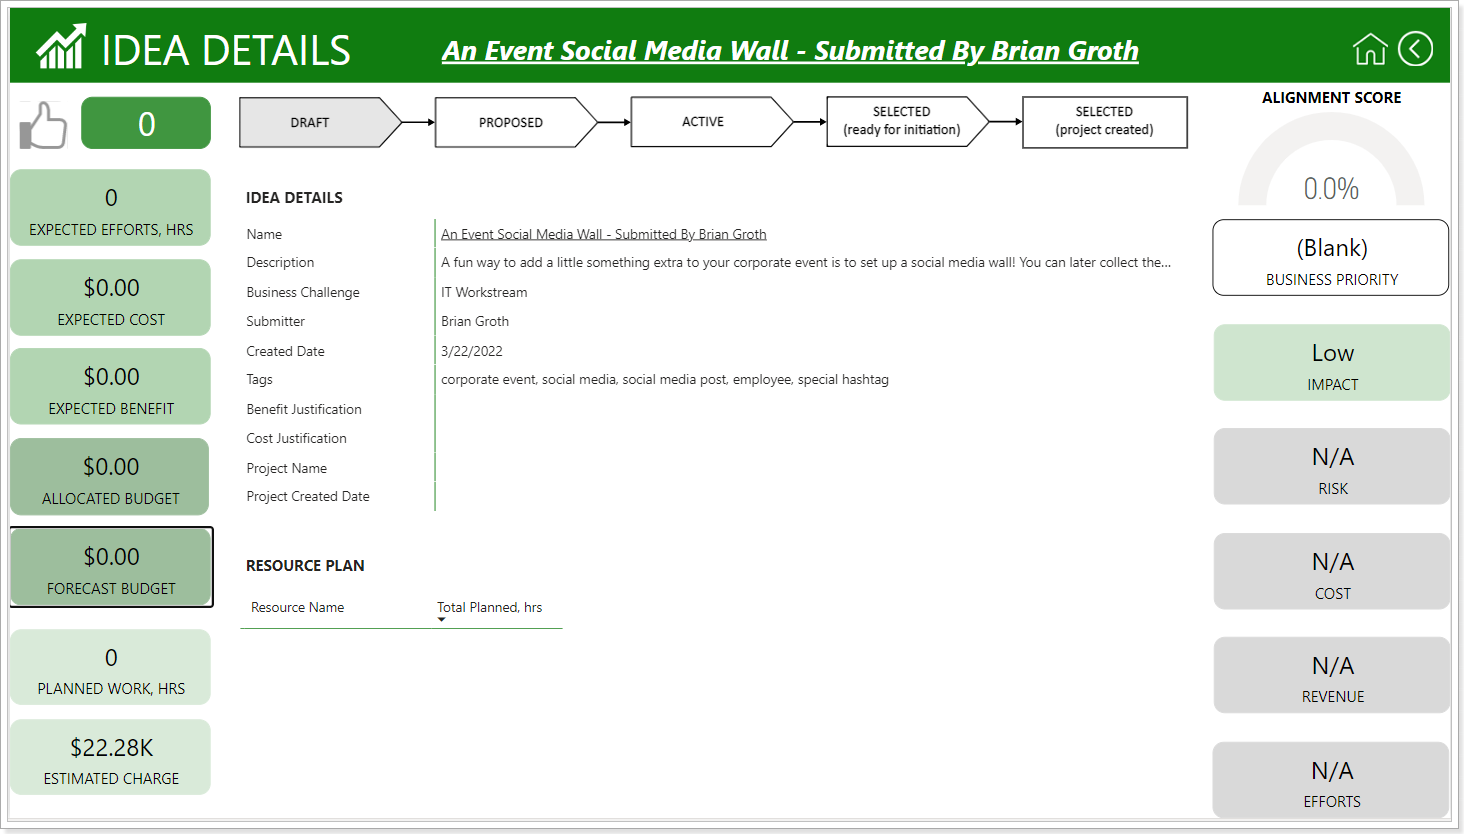
Idea Details report
This report represents details about the ideas. To open it, right-click on the idea in the list of the Idea Registry report.
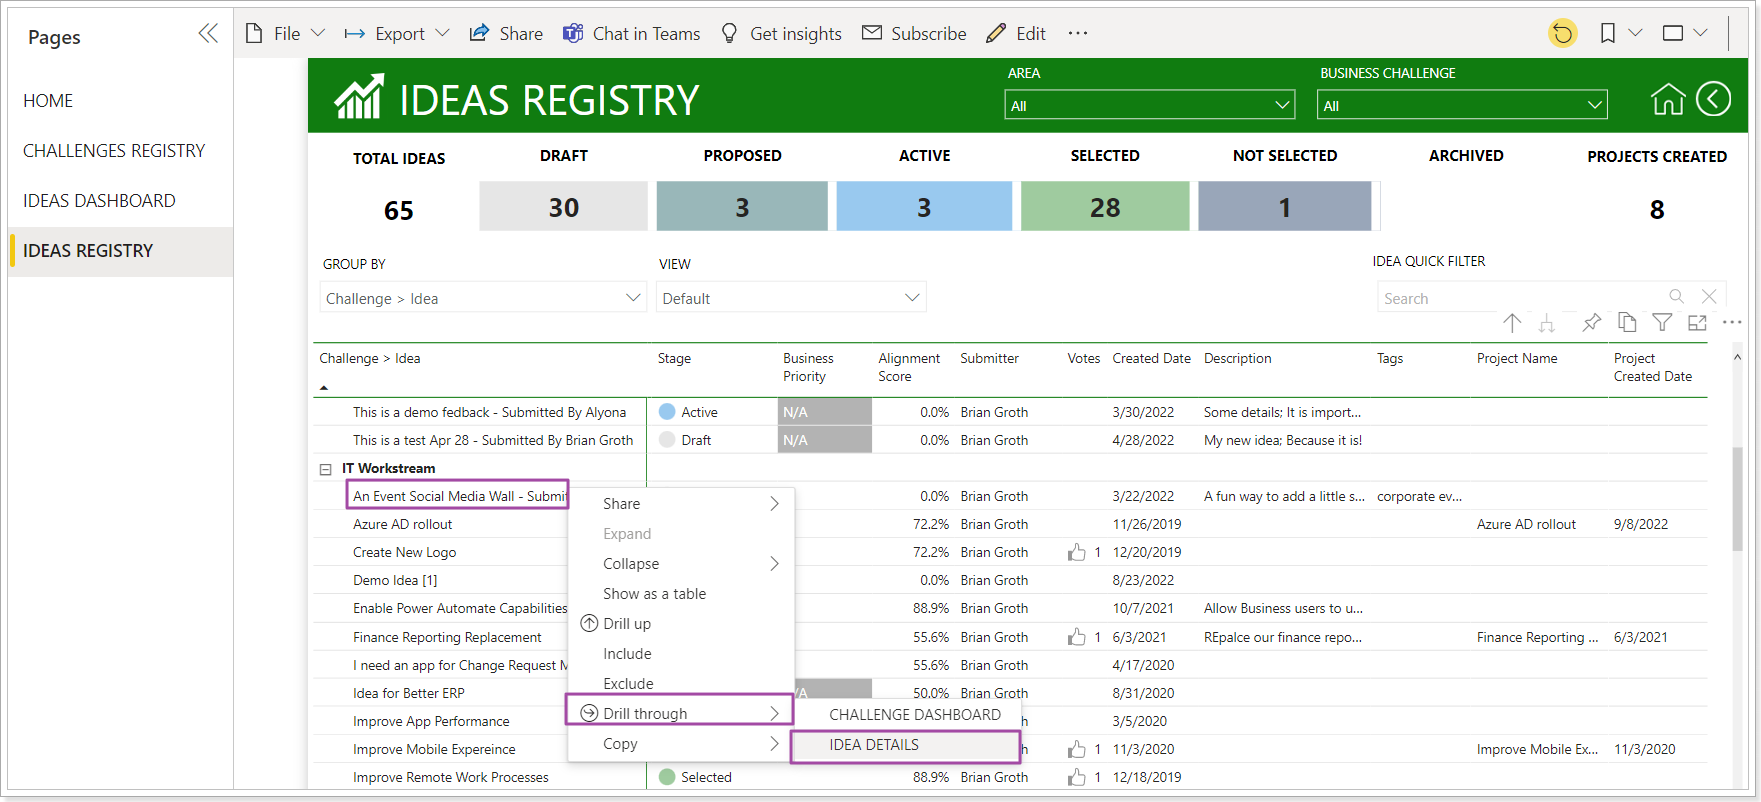
As a result, the Idea Details report will be opened.