The Project dashboard offers centralized access to view and edit all project-related information. This guide provides detailed instructions on the functionality and customization options available.
Overview of the dashboard
The Project dashboard consists of the Summary information and multiple Project sections.
The following sections are visible on the Project dashboard by default:
- Statuses
- Timeline
- Key Dates
- Iterations
- Details
The following sections are optional and can be added using the Layouts and Views menu:
- Team, Schedule, Resource Plan, Risks, Issues, Budget, Benefits, Strategic Alignment, Key Decisions, Action Items, Lessons Learned, Steering Committee, Change Requests, Dependencies, Deliverables, Roadmaps, Process and more.
The Project dashboard is highly customizable, allowing users to tailor its sections, layout, and views to specific needs.
The list of Project sections in your dashboard depends on the view selected on this page (and your permissions for the Project and views).

Customizing Sections
- Use the Layouts and Views menu to add, rename, hide, or reorder sections. Frequently used views can be pinned to the dashboard header for better navigation.

- Rename sections or add descriptions using the pencil icon next to each section.
- Each section can be viewed in full-screen mode.
For detailed instructions, refer to the "How to Create and Apply Layouts" article.
The Summary displays a snapshot of the project's progress, current stage, and status.

Each Project in PPM Express is assigned a process upon creation. For more details, please refer to the Process Management articles.
Key dashboard features via configure menu
- Share Project: Share selected project information with specific users. Assign permissions for View, Edit, or Collaborate roles. Using the Share Project option you can share only the required information about the Project dashboard with the users. This functionality can help limit Project dashboard information for certain users.
- PPM Insights: Access the Insights page.
- AI Project Digest: Generate a digest of project details using AI.
- Using Project Settings you can decide what is the primary project schedule, the calculation type for PPM Express tasks, if the statuses should be calculated automatically for the Project, key dates, and tasks for a certain Project and if the warnings should be displayed.
- Set Baseline: Establish baselines for project metrics.
- Apply Layouts: Apply layouts to the dashboard.
-
Clone Project: Create a full copy of the project.
Only PPM Express data will be cloned, such as Project statuses, Project Dashboard layout, all the fields and columns added or created for the selected Project dashboard, all the settings, Details section information that was provided manually in PPM Express, key dates and iterations added to PPM Express manually will be transferred as well. If the Project was linked to any of the source systems, data synchronized from the source system will not be copied.
The Clone Project option is available for all PPM Express users and does not depend on their permission level. Even a user with view-only rights will be able to clone the Project. - Archive Project: Archive inactive projects.
- Delete Project: Permanently remove a project.
- Activity Log tracks changes, helping users audit updates and understand when and how data was modified.
- New Attachment -> 'Add Link' or 'Upload from Computer'. Using this option, users can upload files from a computer or add links to external resources such as OneDrive, SharePoint, Google Drive, and others.

The Search option is available for multiple sections; it allows you to find the items you need quickly. For more details, please refer to the 'How to use the Search option' article.
Default Project sections
Timeline
Shows project start and end dates, key dates, and iterations.
A dotted line on the timeline indicates that key dates or iterations fall outside the defined project start and end dates.
Dotted Line Logic:
- No start/finish dates: Displays one month before today and two months after.
- Start date only: Displays three months after the start date.
- Finish date only: Displays three months before the finish date.
If there are no start and/or finish dates for the Project, you will see the Dotted line in the summary section. 
If the PPM Express Project is linked to any of the Connections, Project progress will be displayed on the Linked Project button for each Connection separately (as one Project can be linked to several Connections at once).
On the project timeline, only those iterations that fully or partially fall outside the current project progress are displayed. If an iteration starts earlier but continues beyond the current progress point, only the part that extends past the progress will be shown. For example, if an iteration starts in June but the project’s progress already covers part of it, you’ll only see the portion that goes beyond the current progress.
.png)
Statuses
Includes six default statuses: Overall, Risk, Issues, Resources, Cost, and Schedule.
Key Features:
- Additional statuses can be added, renamed, or reordered. For more details, please refer to the 'How to customize status categories for Projects/Programs/Portfolios/Tasks/etc' article.

- Statuses can be auto-calculated or manually overridden for a specified period. The auto-calculation of the Project statuses is enabled by default, and the 'Allow to override status and description manually' option is on. It allows users to override the automatically calculated status and set the required status manually, and select the period of time for which the status set manually will be set. After this period of time (3, 5, 7, 10 days) the status set manually will be overridden by the status calculated automatically. Users can also add/edit the status description. The administrator can change these settings on the PPM Insights page. If the auto-calculation option is not enabled, all newly created Projects are created with N/A status, and then the status is updated by users as required.
- If mapping is configured, the data can be synchronized from external systems (applies to Project Online and Azure DevOps).
- To set the required value for each status, click on the status to open it for editing. The following values are available for each status: N/A, On Track, At Risk, Critical, and Done. Select the one you need, populate the description, and click the Update status button to save the changes.
Status History
- Tracks changes, showing who made updates and when.
- Status history can be deleted by users with "Administrate App" permission (except for the latest update).
Views Available:
- Card View: Displays the current status.
- History View: Shows all past status changes. When you start adding information for your Project statuses, you can then track the status history for all Project statuses at once.

Key Dates
The Key Dates section displays milestones and key dates either synchronized from external systems or created manually in PPM Express.
Views Available:
- Timeline View (default): Shows milestones along a timeline.
- Table View: Displays key dates and their statuses in a tabular format.
PPM Express allows the creation of three types of Key Date entities:
- Milestones
- Releases
- Key Dates
Status Calculation:
Key Date statuses are calculated automatically based on the finish date relative to the current date. The following statuses are assigned:
- On Track: Finish Date is greater than or equal to today.
- At Risk: Key date is overdue by less than 10 days.
- Critical: Key date is overdue by more than 10 days.
- Done: Key date is marked as complete.
To disable the automatic status calculation, visit the Insights Settings page. For more details on customizing status categories, refer to the article: How to Customize Status Categories.

Each Column can be edited as well. To edit a column, open the Configure Column menu and click on the pencil-like button to start editing it.
Creating Key Dates:
- Click the New Key Date button to create a key date.
- In the Key Date creation panel:
- Select the key date type (Milestone, Release, or Key Date).
- Enable the Show on Timeline checkbox to display the milestone on the project’s main progress bar in the Summary Section.
- The Status field is read-only during creation and is calculated automatically after you click the Create Key Date button.
Baseline Management:
PPM Express allows setting baselines for Key Dates:
- Select the desired Key Dates and click the Set Baseline button (the baseline is created for the Date field).

- To edit a Key Date, open it, and once all required fields are completed, the Baseline Tab becomes active.
- To remove the baseline mark from the timeline view, click on the Style option and disable the Show Baseline checkbox.

Key Notes:
- Rolled-Up Key Dates: Baselines for rolled-up Key Dates (imported from Projects to Programs or Portfolios) are read-only.
- Baselines can also be set for Key Dates imported from external systems.
- Projects, Portfolios, and Programs. Changes made in one will reflect in all.
Iterations
Displays iterations from external systems (e.g., Azure DevOps, Jira) or those created in PPM Express.

Views Available:
- Timeline View: Displays iterations chronologically.
- Table View: Provides detailed iteration information. Four columns (Title, State, Start Date, and Finish date) are displayed by default for the Table view.
All available work item types are enabled by default in the 'External Items Mapping' tab, and after the synchronization, they become available under the 'Configure Connection' menu.
Disabled work item types in the 'External Items Mapping' tab will not be available under the 'Configure Connection' menu.
Key Features:
- Work item types are displayed as completed/all items.
- Export Options:
- When exporting to .csv, only the default fields (Title, State, Start Date, Finish Date, and ID) are included.
- When exporting to PNG, all fields are supported.
- Views and layouts are shared per scheme for Jira connections. If you add any work item types for View/Layouts for Project1 and navigate, e.g., to Project2, work item types for View/Layouts will be displayed as for Project1.
- Work item values within iterations from Azure DevOps and Jira are clickable, allowing the filtering of the information by the work item included in the iteration. The Task Page opens, displaying only the items of the selected work item type in that iteration.
- Use the 'New Iteration' button to create new iterations.
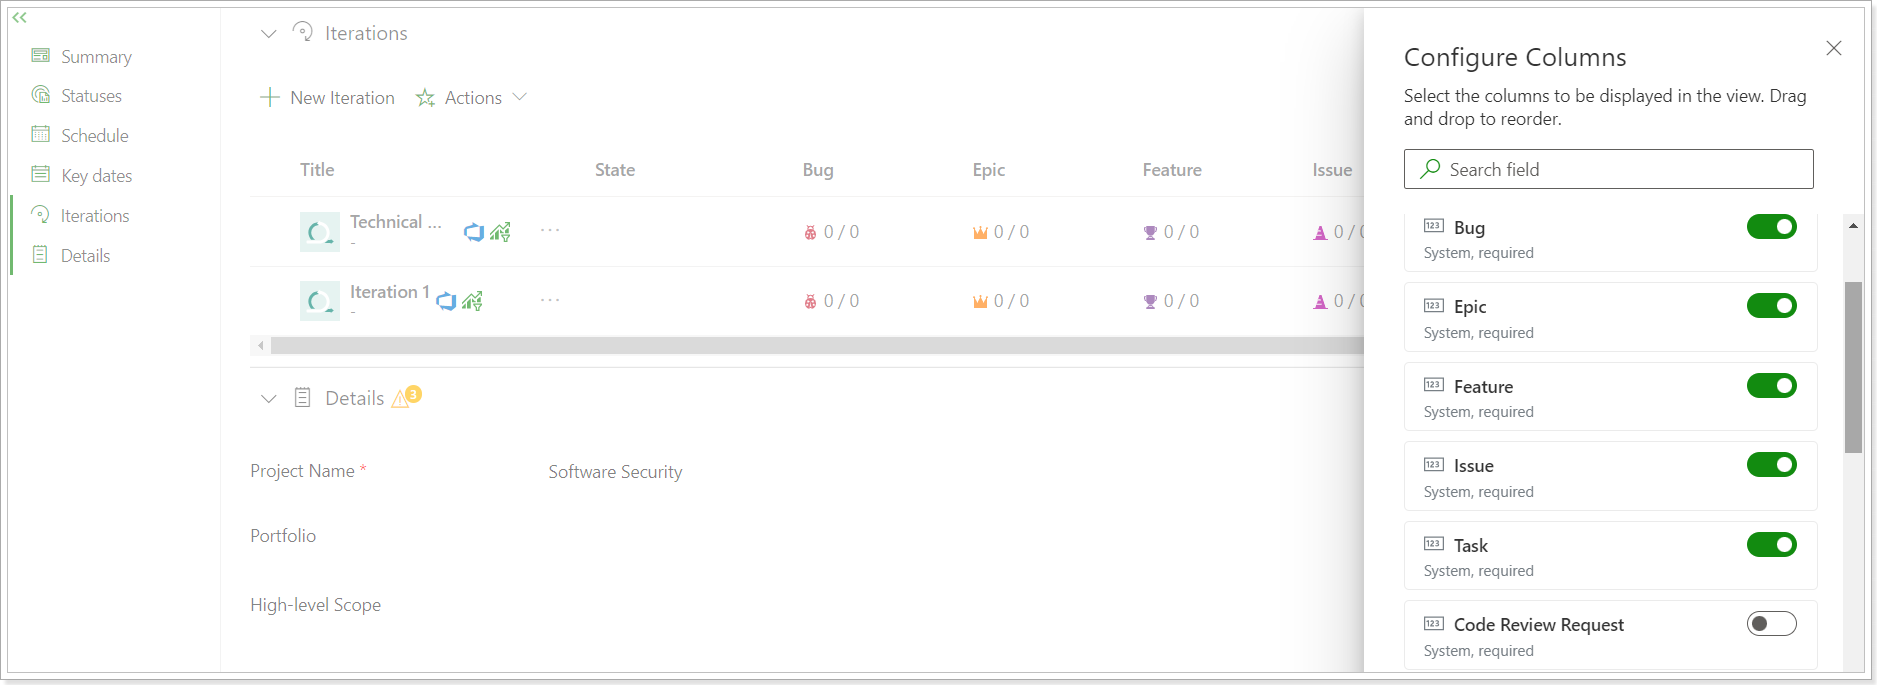
- Click the 'Configure Columns'button to:
- Show or hide specific columns.
- Add custom fields.
- Rearrange columns by dragging and dropping them in the desired order.
Details
Contains essential project information, including rolled-up metrics from tasks and synchronized data from external systems (if mapping is configured).
For detailed information about field mapping please refer to 'How to set up additional fields mapping for Project Online' and 'How to set up additional fields mapping for Azure DevOps' articles.
Key Features:
- Customizable fields.
- Rolled up fields from the PPM Express tasks schedule, effort and progress are also available. This way, you can see the main values from your PPM Express tasks schedule on the Project level. You can also add them to the KPI section for quick access to the important Project metrics. To enable these fields, open the Configure Fields menu from the Details page, and start typing 'schedule' in the search field to quickly find and enable them all. The fields will become available for review in the Details section. The information button next to each field shows the details for the field value calculation.
Optional Dashboard Sections
To see the list of available sections, click on the ellipsis button next to the view open the view for editing, and add the Project sections you need.

Only PPM Express administrators with Manage Configuration permission can edit the existing views or create new ones.
As a Project Manager or a user with edit permission, you can edit the default view of your Project and switch between all existing views to change the list of available sections.
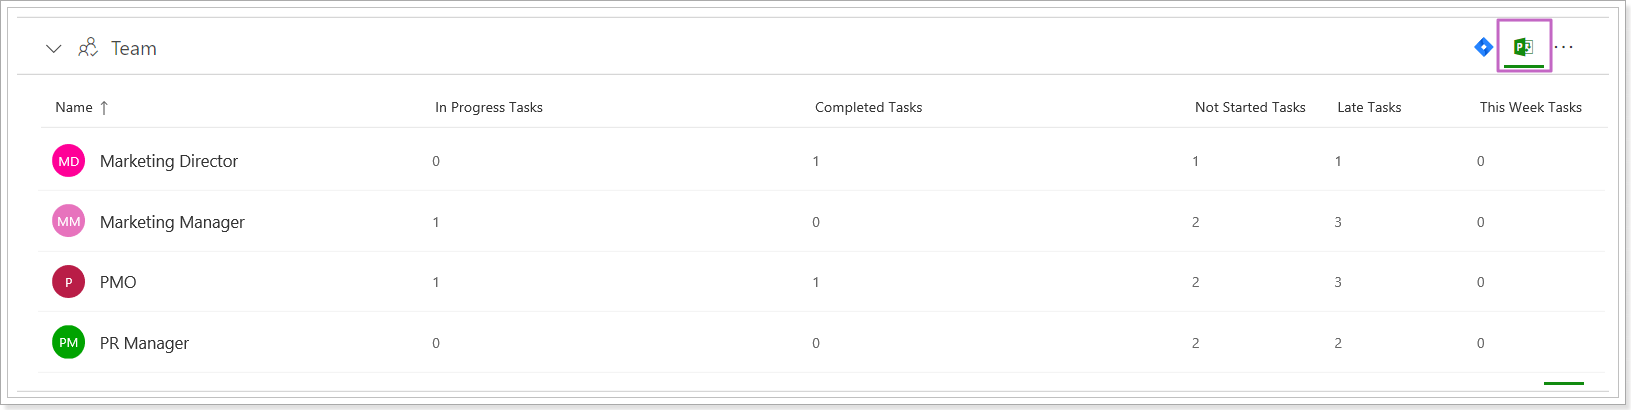
Team
This section shows the list of resources assigned to the Project tasks on the Project tasks page.

Key Features:
- Includes detailed information about each resource and their respective task assignments.
- If external connections are added, the Team section shows a list of employees involved in the project, along with their tasks (both pending and completed).
- This section is read-only, and the data is retrieved automatically during synchronization.
- For projects linked to multiple connections (source systems), you can switch between connections to review project team information specific to each source system.
The Team section has Linked Project buttons using which you can select the Connection linked to this Project and review data synchronized from each Connection separately. To find more information on how to add several Connections to one Project, refer to this article.
Project Online Team is selected on the example below:
Tasks (Schedule)
The Tasks (Schedule) section provides an overview of tasks within the project. It offers insights into the project's task status and schedule, enabling better project management and monitoring.
Key Features:
This section displays all tasks and issues associated with the project.
It is non-editable and reflects the task data as configured on the Project Tasks page.
Tasks added to the Task Statuses section on the Project Tasks page are automatically displayed in the Tasks (Schedule) section of the Project dashboard.
Clicking on a task number redirects you to the Tasks page, where:
- The task list is filtered based on the selected status (e.g., "Late Tasks").
- The relevant tasks are displayed for review and action.
Configuration Options
- Use the Configure menu to customize the data sections visible on the page.
- Drag-and-drop functionality allows reordering of sections for better organization.
- Changes can be saved as part of the Project Layouts and Views.

Integration with External Connections
- Data for the Tasks (Schedule) section is retrieved from the connected external systems during synchronization.
- Task statuses are automatically updated as part of project data synchronization.
- For projects linked to multiple source systems (Connections), the Schedule section provides:
- Linked Project Buttons to switch between systems.
- A separate task page for each connection, where data synchronized from each system can be reviewed independently.
- Refer to this article for guidance on adding multiple connections to a single project.
- Task statuses and schedule information are refreshed during synchronization with the connected systems, ensuring up-to-date data for project management.
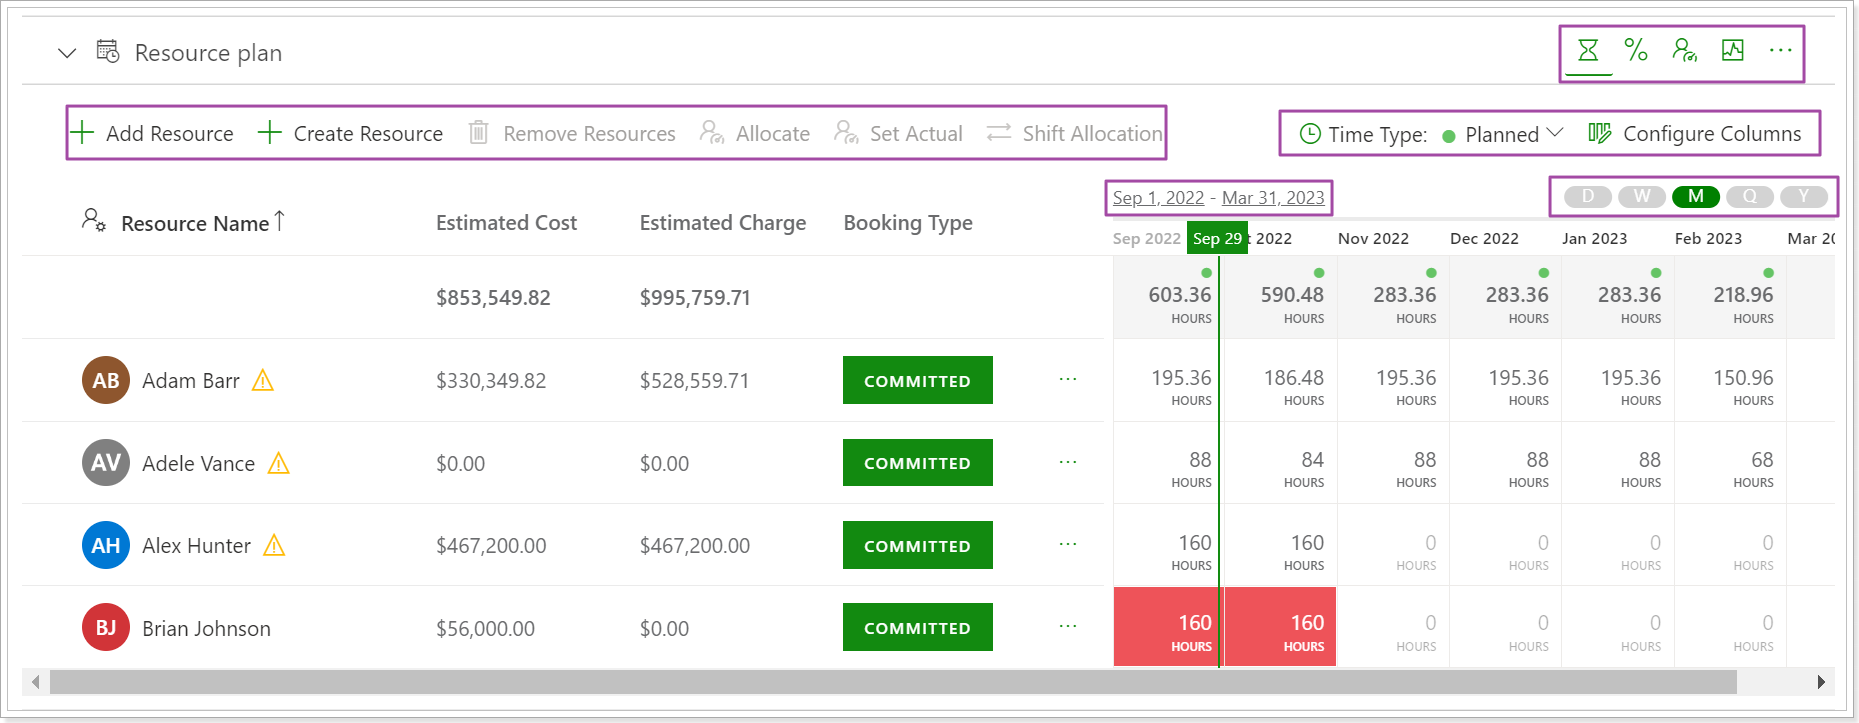
Resource Plan
The Resource Plan section on the Project Dashboard provides project managers with tools to organize their teams, manage resource utilization, and track resource capacity effectively. This section is accessible when the Project Level is selected for Resource Planning in the tenant settings.
Centralized Resource Planning
- Resources added to the Resource Plan appear on the Resources page, offering visibility for resource managers and team members into their assigned projects.
- Allocation views are flexible and can be displayed in Hours, Percent, FTE, or Chart Views.
- Resource timelines can be reviewed by Day, Week, Month, Quarter, or Year, providing comprehensive planning options.
User Permissions and Access
- Only users with Manage Resources permission and Project Edit permissions can add resources and allocate them in the Resource Plan.
- The Resource Plan section is available in View Only mode for users with edit/view permissions for the project.
Resource Status Management
- Resources can have two statuses: Active and Inactive:
- Active Resources: Can be assigned to tasks, key dates, risks, issues, etc.
- Inactive Resources: Do not appear in the available resource list for new assignments.
- Preservation of Assignments: If an active resource is assigned tasks and later becomes inactive, all existing assignments and allocations will remain preserved in the Project Plan section.
Customizable Columns and Fields
- Use the Configure Columns button to show, hide, or rearrange columns by dragging and dropping.
- Custom fields can be added from the Resource Dashboard Details section. These custom fields are shared across all PPM Express entities, ensuring consistency and flexibility.

For more comprehensive resource management tools, refer to this article on Resource Management in PPM Express.
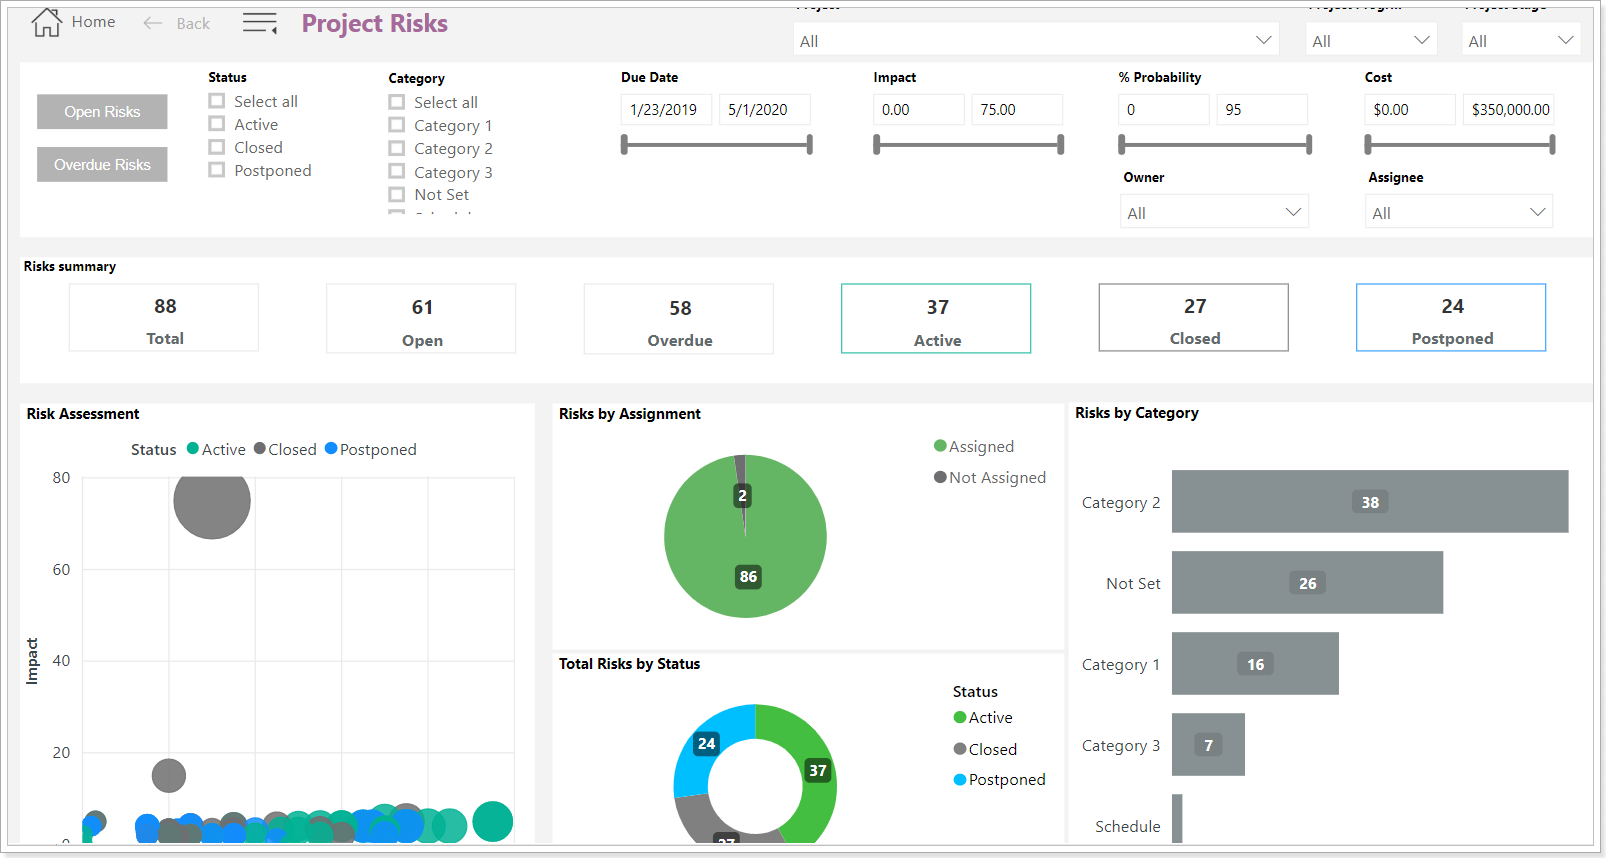
Risks
This section displays risks synchronized from an external system (applies to Project Online connection) and risks created in PPM Express. Use the New risk button to open the Risk edit menu.
The Configure Columns button is used to show or hide specific columns from the list or add a custom field or rearrange their order (by clicking and dragging).

Risk Management functionality in PPM Express supports the concepts of Inherited and Residual risks, helping you evaluate and compare the risk level before and after mitigation.
- Inherited Risk represents the original risk level, the probability, and impact before any actions or controls have been applied. It shows how severe the risk would be in its raw form.
- Residual Risk represents the remaining risk after you’ve applied mitigation or control measures. It helps you assess how effective your actions were in reducing the overall exposure.
To support these concepts, PPM Express includes additional fields for risks:
- Impact: The potential severity of the risk’s consequences after mitigation (Residual Impact). Recommended range: 1 (low) to 10 (high).
- Probability, %: The likelihood of the risk occurring after mitigation (Residual Probability). Scale: 0–100%.
- Residual Risk Score: Calculated as Residual Risk Score = (Probability, % * Impact) / 100.
This field represents the risk level after mitigation. This field is system-calculated and cannot be edited manually on the UI, via CSV import, sync, or via API. - Inherited Probability, %: The likelihood of the risk occurring before mitigation or control. Scale: 0-100%.
- Inherited Impact: The potential severity of the risk’s consequences before mitigation. Recommended range: 1-10.
- Inherited Risk Score: The initial risk score is calculated as (Inherited Risk Score = (Inherited Probability % * Inherited Impact) / 100, representing the risk level before mitigation.
This field is also system-calculated and cannot be edited manually, via import, sync, or API. - Mitigation Plan: Describes measures implemented to reduce the probability or impact of a risk.
- Contingency Plan: Outlines the response actions if the risk occurs.
When a project is initiated from an Idea with Risks, the risks are copied into the project with their field values.
Issues
This section displays issues synchronized from an external system (applies to Project Online connection) and issues created in PPM Express. Use the New issue button to open the Issue edit menu.
The Configure Columns button is used to show or hide specific columns from the list or add a custom field or rearrange their order (by clicking and dragging).

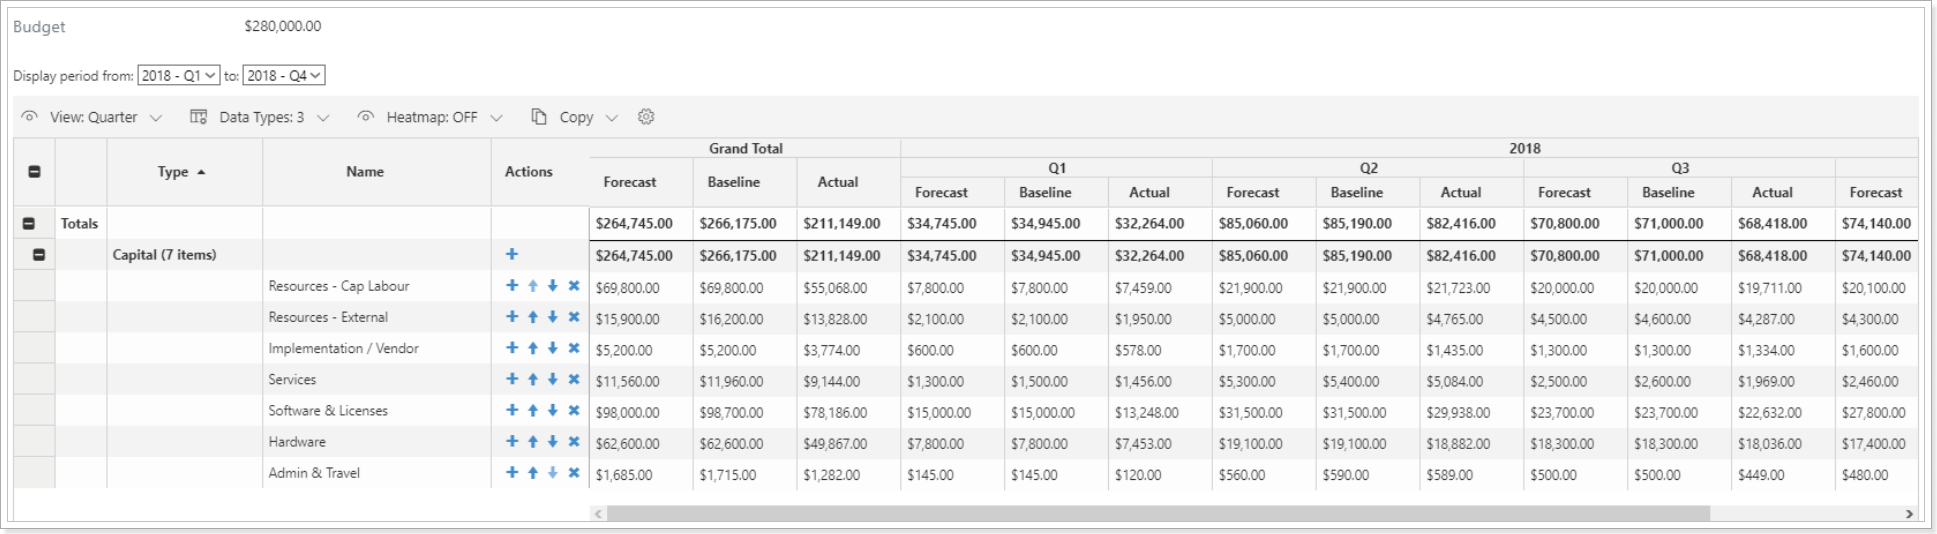
Budget
This section uses the Financials app allowing editing the Portfolio budget.
Viewing or editing budgets can only be done by the users who have Manage Financial Details permission enabled in their account settings.
If you would like to change the currency for the PPM Express tenant, please refer to this article to find step-by-step instructions.
You can find more on creating and editing a budget in the Managing budgets help article.
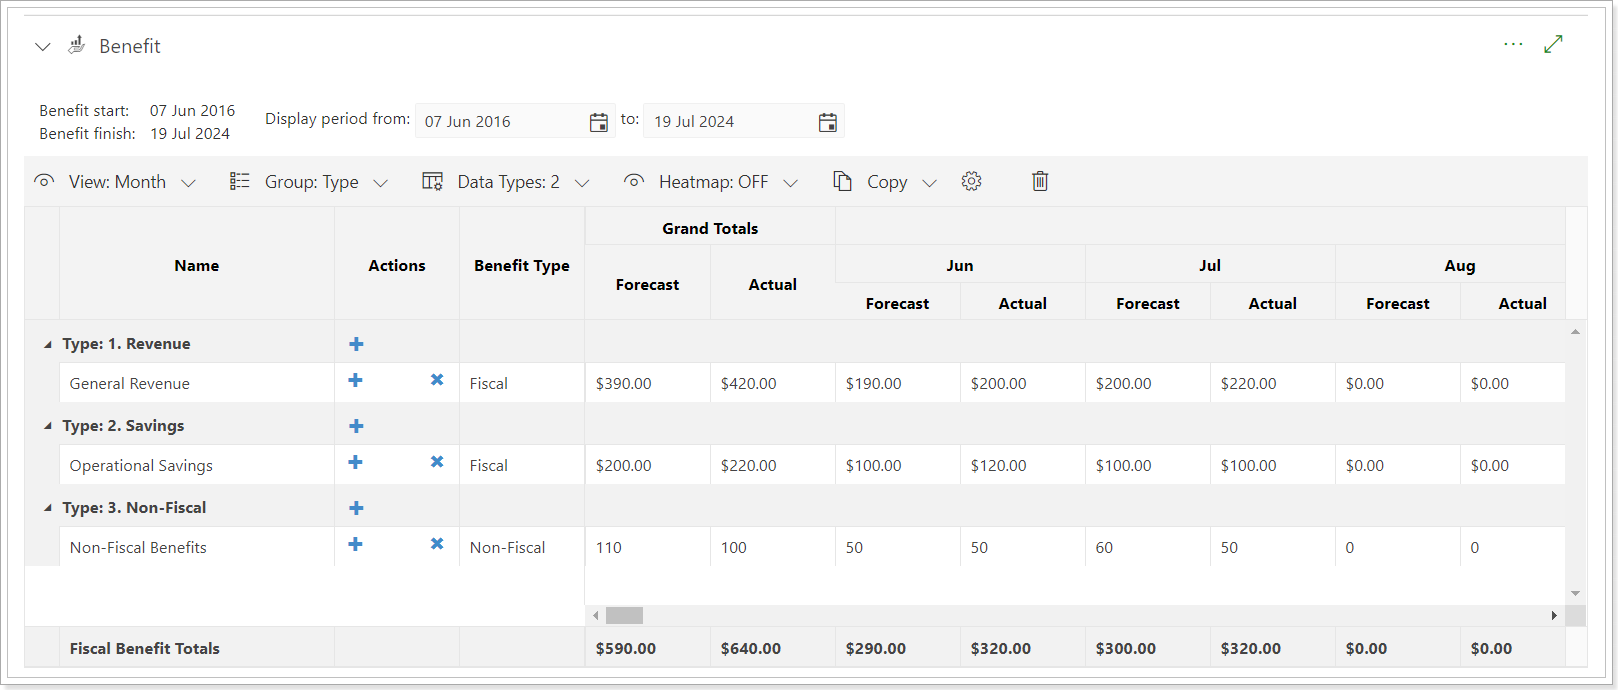
Benefits
This section is available for users with Manage Financial Details permission.
The Benefits Project section is similar to the Budget section and is configured via the Financials widget.
Two formula fields were added for this section to display data as needed: Estimated ROI and Estimated ROI Baseline.
- Estimated ROI = ((Benefits Forecast - Budget Forecast)/Budget Forecast) *100% (if at least one parameter is 0, the value will be 0)
- Estimated ROI Baseline = ((Benefits Forecast - Budget Baseline)/Budget Baseline) *100% (if at least one parameter is 0, the value will be 0)
By default, the Benefit start & finish dates displayed in this section correspond to the Project Start and Finish dates. However, you can adjust the Benefit start & finish by adding Benefits Start Date and Benefits Finish Date fields to the project Details section.
There are two Benefit types: Fiscal and Non-fiscal.
The settings and fields are similar to the Budget section.
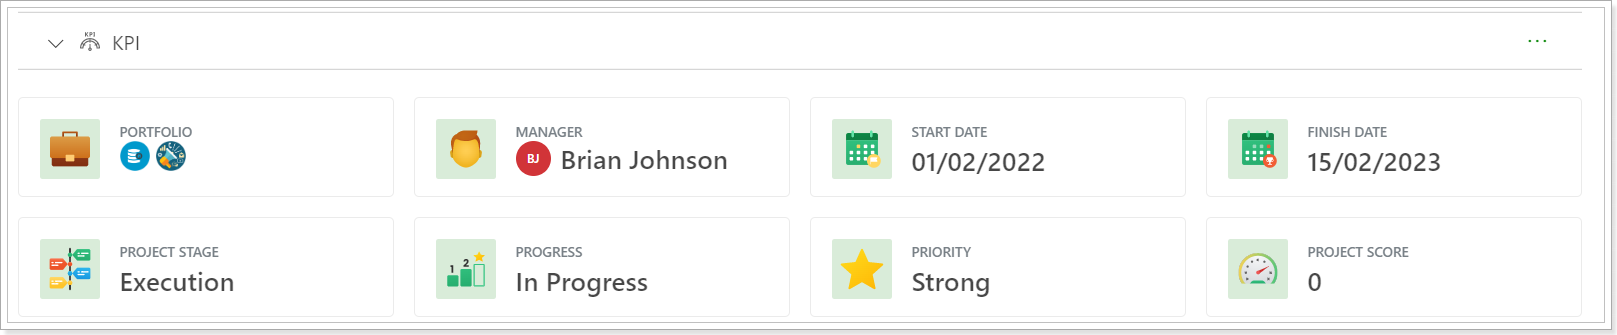
KPI
This section allows you to review the fields you need for the Project quickly. You can edit the KPI section, and add and remove the fields you need to display in this section. It is an easy and visual way to monitor some metrics and details at the Project level.
Also, it is possible to edit the KPI section in different ways for different views. For example, you can create a Resource Plan view and customize the KPI section to show only the fields that are important for the resource plan. If you create a Budget view, you can customize the KPI section to show the important fields for the budget, and add the budget section to this view only.
Lessons Learned
This section allows adding information on the lessons learned through Project duration. The lessons learned section also focuses on identifying Project successes and failures and includes recommendations on how to improve future performance on Projects. Use the New Lesson button to open the edit menu. Configure Columns button is used to show or hide specific columns from the list or add a custom field or rearrange their order (by clicking and dragging).

Action Items
This section allows tracking of activities related to the successful delivery of the Project, but not being tracked as part of the Project schedule. It allows assigning an owner, the date assigned, the closed date, and the status, so that action items are properly recorded and action is taken to address and complete them. Use the New action item button to open the edit menu. Configure Columns button is used to show or hide specific columns from the list or add a custom field or rearrange their order (by clicking and dragging).

Key Decisions
This section allows adding information for the key decisions, adding people, dates, and descriptions of the key decisions on the Project. Use the New key decision button to open the edit menu. Configure Columns button is used to show or hide specific columns from the list or add a custom field or rearrange their order (by clicking and dragging).

Steering Committee
This section allows adding people who are in charge of the Project or representatives of all Project stakeholders, if needed, whose main task is to monitor the Project. Use the New Person button to open the edit menu. The Configure Columns button is used to show or hide specific columns from the list or add a custom field or rearrange their order (by clicking and dragging).

Change Requests
This section allows adding Project change requests to define how that impacts the scope of the Project. Use the New change request button to open the edit menu. The Configure Columns button is used to show or hide specific columns from the list or add a custom field or rearrange their order (by clicking and dragging). The filter option allows filtering change requests.
Change requests can be assigned to resources. When the change request is created and assigned, resources receive email notifications (if the notifications on PPM Express actions are enabled). Requesters/Deciders/Resources assigned receive notifications on any changes.

Strategic Alignment
This section shows all strategic priorities on the organization level that are added to the Strategic Priorities page. By default, the impact of the strategic priorities in this section is set to N/A.
Users who create and manage Projects can decide how organizational priorities impact the specific Project by setting the Impact of each priority in the Strategic Alignment section.
As the impact is set for each priority in the Strategic Alignment section on the Project dashboard, the Alignment Score field in the Details section is populated with the value. This value takes into account the Importance of the strategic priorities set on the Strategic Priorities page and the Impact set by the Project manager in the Strategic Alignment section. The percentage in the Alignment Score field shows the Project compliance with company strategic priorities.
The higher the number in the Alignment Score field, the more the Project is consistent with the priorities of the company.

If there are any changes in the priorities on the Strategic Priorities page (changes in the Importance of the strategic priorities, new priority added, the priorities are edited or deleted, the priority activated/deactivated), Project managers will see a message in the Strategic Alignment section as for the changes on the Strategic Priorities page.

If the Project manager clicks the Apply Changes button, the changes will be applied automatically, and the Alignments Score field will be recalculated according to the changes applied.

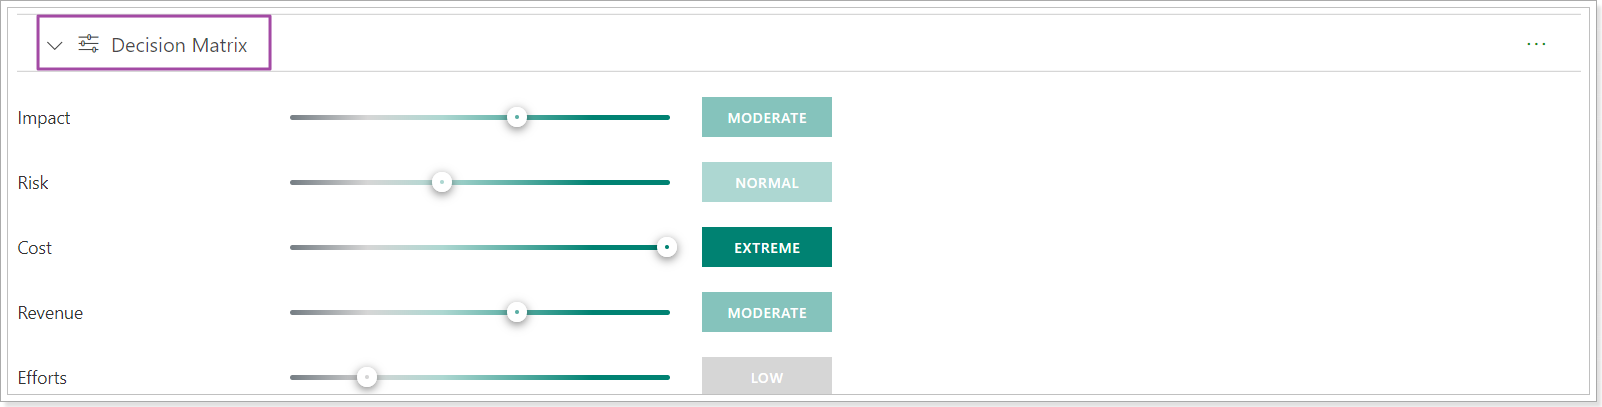
Decision Matrix
This section helps to make decisions for Projects or ideas efficiency and benefits for your organization. As a Project Manager, you can set Impact, Risk, Cost, Revenue, and Effort values for your Project and based on the given values make a decision on whether it is worth continuing with this idea or Project.
Time
This section helps Project Managers to review the time that employees track within the Time Tracking module (My Time page).
The time the team members have already tracked on the PPM Express tasks will appear in this section.

OKR
PPM Express provides an ability to add Key Results created in the OKR module to the Project Dashboard OKR section.
When the Key Results are added to the OKR Project section, these Projects become contributing Projects of the Key Result and, thus, Objective.

Dependencies
PPM Express provides the ability to specify and manage both internal and external activities that relate to your Project. You can select a PPM Express Project, Idea, or any external activity as a dependency type and specify its relation to your Project.
Select the “Depends on” relation type if the current Project depends on another Project or activity. Select the “Delivers to” relation type if another Project or activity should not start before you finish a current Project or some activity, such as a task, key date, etc., in it. “Related to” relation type can be selected for ideas, Projects, or external activities that relate to your Project but are not necessarily interdependent.
You can use default filters or create your own, as well as configure columns and new fields relevant to your Projects.

For the “Project” type, we recommend using “Depends on” and “Delivers to” relation types, as when any of these types is selected, a corresponding arrow will be drawn from your Project to another one or vice versa. The arrows will be displayed on all Timeline views, such as Portfolios/ Programs/ Projects timelines or the “Projects” section inside Portfolio or Program.

To enable/disable the Dependencies section and manage it, the user should have the Administrate app permission or be a manager of the Project. If the user is not a Project manager but has permission to edit the Project, such a user can enable/disable this section and create dependencies as required.
Users who have View permission for the Project cannot enable/disable the Dependencies section, but they can create dependencies for the Project. To create a dependency on Ideas, users should have the Manage Challenges and Ideas permission (otherwise, users will be able to create dependencies on their own ideas or the ones that are in the Active/Selected/Not Selected/Rejected statuses).
Also, the cross-project dependencies are available for PPM Express tasks. For more details, please refer to this article: Cross-Project Dependencies.
Purchase orders
The 'Purchase Orders' section provides the ability to add orders to the Project.
When the order is added, it can be edited or deleted, users can configure columns for this section, export orders to PNG files, and import orders from CSV to PPM Express.

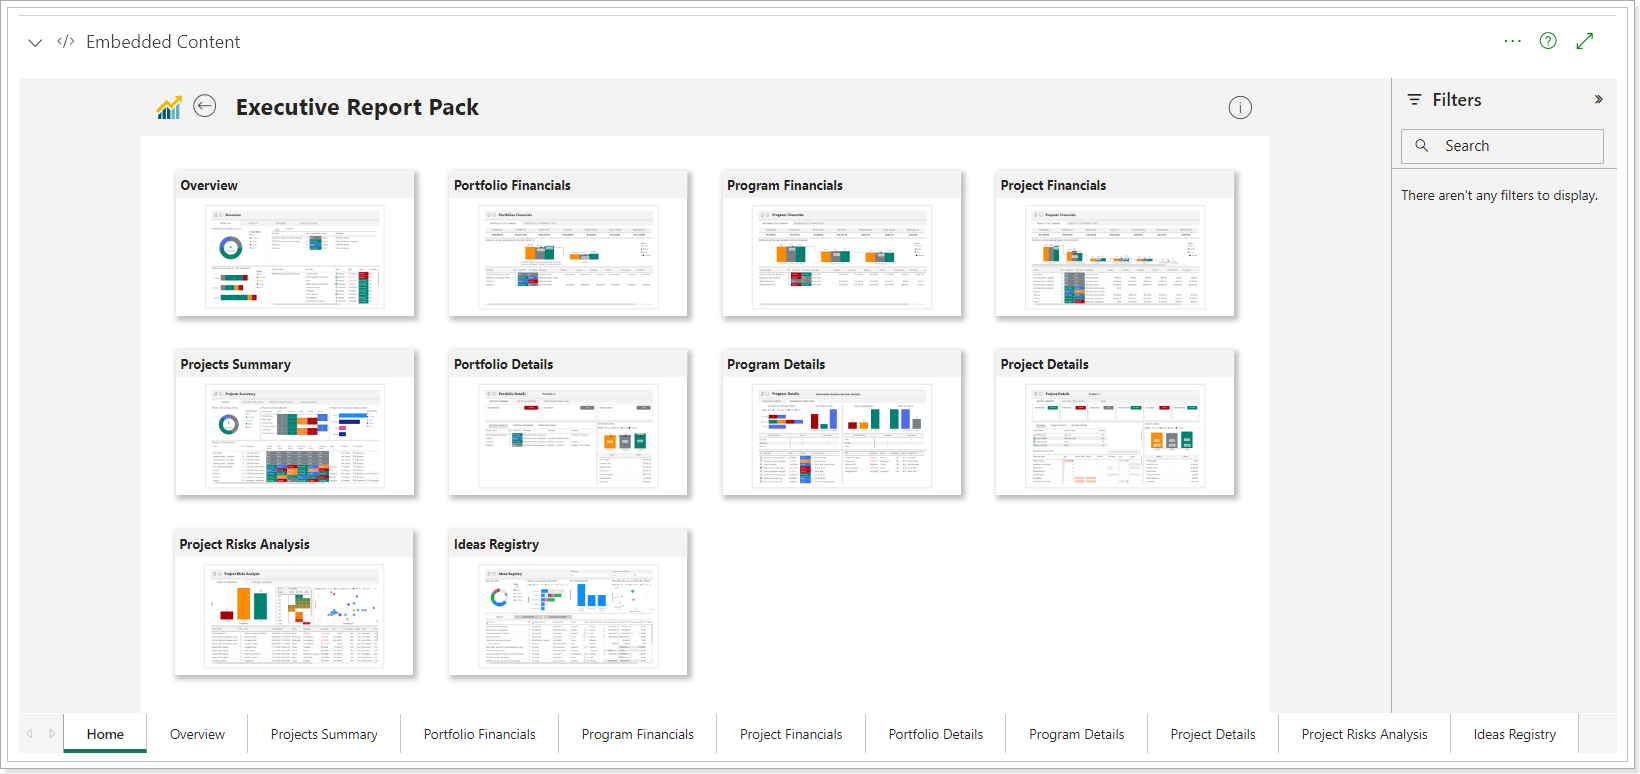
Embedded Content
The 'Embedded Content' section allows embedding external links, videos, web pages, or documents to PPM Express dashboards. This section can also embed PPM Express Power BI Reports into the dashboards to access the required report easily. For more information about the section, please refer to the "How to use the Embedded Content section" article.
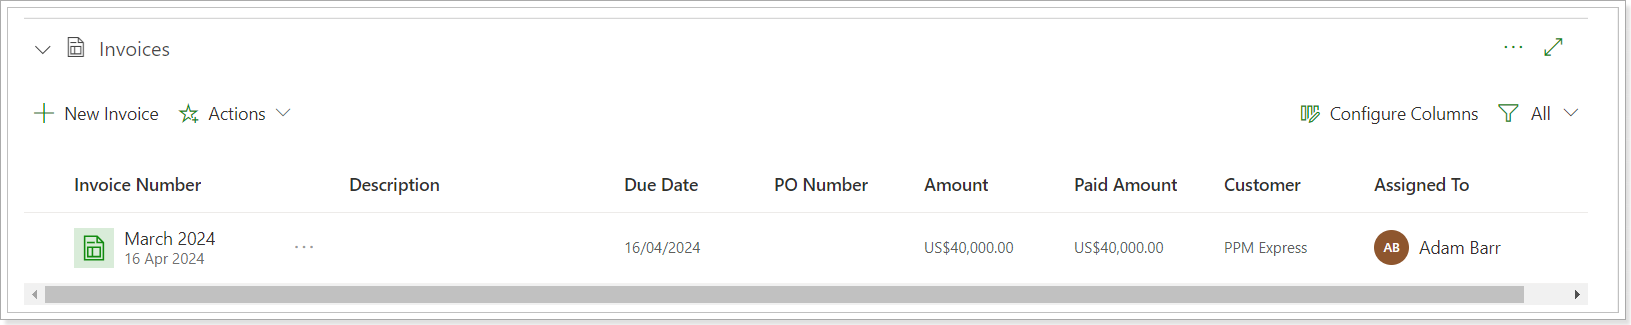
Invoices
This section allows adding invoices to the Project.
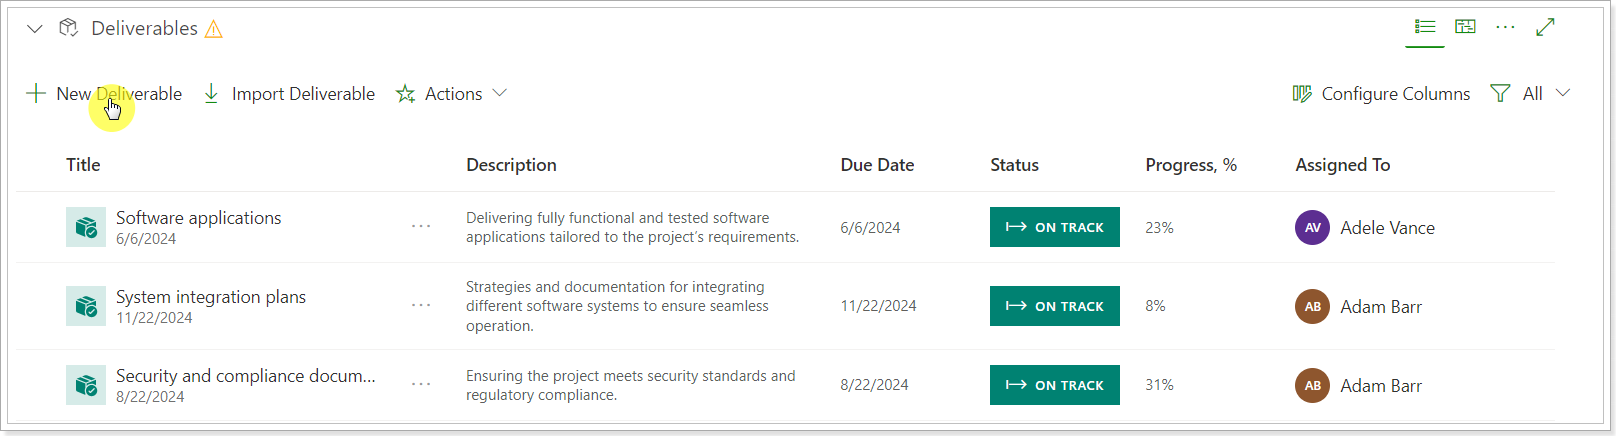
Deliverables
This section allows creating and managing Project Deliverables. It has two views: Table and Timeline.
You can create new Deliverables, Import them from external systems, Import them from the .CSV file, and Export to PNG. Also, configure columns and filtering options are available.
For more details, please refer to the 'How to import Deliverables' article.
Roadmaps
The Roadmap section displays the selected existing Roadmap on the Project dashboard directly. To add Roadmaps, users must have View or Edit permission for the original Roadmap.
Only Administrators and Project Managers can import Roadmaps to the default view of the Project dashboard. To add the Roadmap to the custom view, users should have the Manage Configuration permission.

The added Roadmap will be available in read-only mode on the Project dashboard.
- The Configure option allows users to select a different Roadmap.
- The Open Roadmap option will open the original Roadmap page in a new tab.
- The Clear option will remove the Roadmap from this section.

The Styles will be shown according to the original Roadmap default view. If the original Roadmap was shared with a user via a specific view, that user will not be able to see the Roadmap added to the Project dashboard if they do not have permission to access the default view of the original Roadmap.
Process
Each project in PPM Express follows a structured process that defines its workflow through various stages. The process is assigned when the project is created and determines how the project progresses over time.
Two views are available for the Process section:
- Flow Chart (Default) – A visual representation of project stages.
- List – Displays stages in a structured table format.

For more details, please refer to the Process Management articles section.
Attachments
Attachments can be added from the Attachments project section. Users can upload files from a computer or add links to external resources such as OneDrive, SharePoint, Google Drive, and others. For more details, please refer to the Project Attachments in the PPM Express article.

Images
The Images section is available for Projects, allowing users to display image attachments in a gallery format. It includes only image-type files (.jpg, .jpeg, .png, .gif, .webp) that are already uploaded to the Attachments section. Users can select several images at once. Images are shown in the order they are selected. The Images section is directly linked to the Attachments section.

PPM Express Power BI Reports
PPM Express provides over 50 accurate and comprehensive Power BI reports with a graphical representation of PPM Express data.
PPM Express provides an ability to review PPM Express Power BI Reports for the following sections Project dashboard includes: Statuses, Key Dates, Iterations, and Details. Optionally the reports can be reviewed for the following sections, if they are added: Team, Risks, Issues, and Budget.
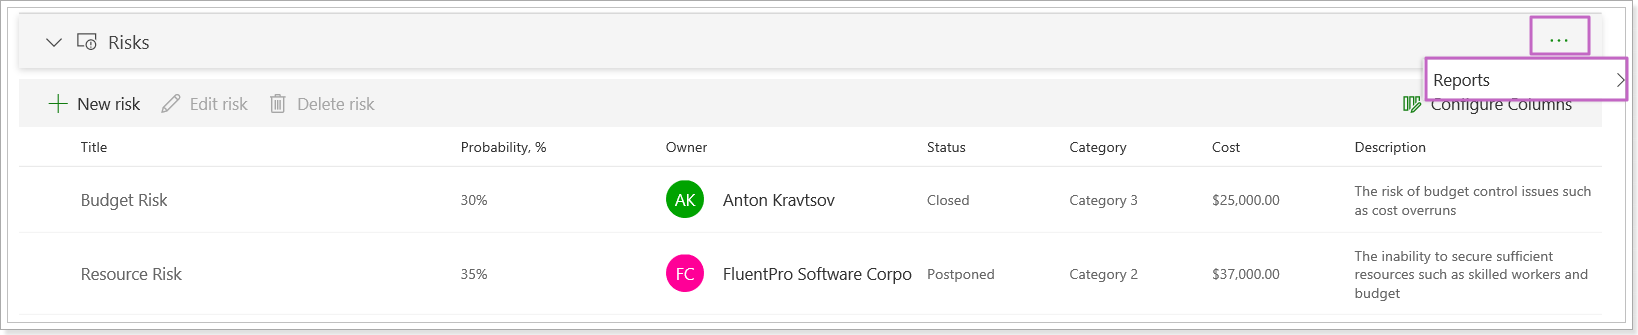
You can access the reports via the ellipsis button, from the drop-down menu, in the upper right corner of each section.
As you click on the report, it will be opened in a new window displaying the information for the selected report.